A
B
C
D
Text Solution
Verified by Experts
The correct Answer is:


Topper's Solved these Questions
Similar Questions
Explore conceptually related problems
SCIENCE OLYMPIAD FOUNDATION -NSO QUESTION PAPER 2018- 19 SET - B-ACHIEVERS SECTION
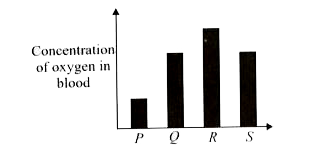
- The given bar chart shows the concentration of oxygen in blood samples...
Text Solution
|
- Study the given flow chart carefully and select the option that correc...
Text Solution
|
- Refer to the given dichotomous key and select the incorrect statement ...
Text Solution
|
- Refer to the given graph representing percentage of undigested starch ...
Text Solution
|