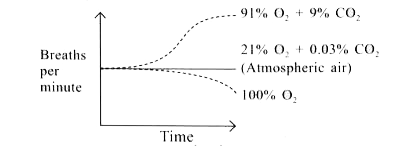
The given graph shows how the rate of breathing of a person changes under different conditions. At the beginning of each experiment, the person is breathing in atmospheric air. What conclusion may be derived from the graph?
A
High level of oxygen in the air causes breathing rate to drop, regardless of carbon dioxide level.
B
Increase in carbon dioxide level in air causes breathing rate to increase upto a limit.
C
Breathing rate is controlled only by oxygen content of air and is independent of carbon dioxide concentration.
D
None of these
Text Solution
Verified by Experts
The correct Answer is:
B
Rate of breathing of a person depends on the concentration of carbon dioxide in the atmosphere. Increase in carbon dioxide level in air causes breathing rate to increase upto a limit. Oxygen does not have significant direct effect on the respiratory centres of the brain in controlling respiration.
Topper's Solved these Questions
NSO QUESTION PAPER 2017- 18 SET - B
SCIENCE OLYMPIAD FOUNDATION |Exercise ACHIEVERS SECTION|2 Videos
NSO MODEL TEST PAPER 03
SCIENCE OLYMPIAD FOUNDATION |Exercise ACHIEVERS SECTION|3 Videos
NSO QUESTION PAPER 2017-18 SET A
SCIENCE OLYMPIAD FOUNDATION |Exercise SCIENCE|19 Videos
Similar Questions
Explore conceptually related problems
The graph below shows the relationships of per capita population growth rate (r), fecundity (b) and age at first reproduction (alpha) in an animal speies What is the most important conclusion to be drawn from the graph ?
Lichens are organisms, which are very sensitive to air pollution. The graph shows how the distance from a coal-fired power station affects the number of different types of growing lichen. What conclusion can be drawn from this information?
The bar graph given below shows the data of the production of paper (in lakh tonnes) by three different companies P, Q and R over the years. What is the percentage increase in the productionby company Q from 2010 to 2013?
On an average, an adult human being at rest breathes 15-18 times per minute. The breathing rate, however, may differ under different conditions. Arrange the following activities given in the box in order of increasing breathing rates and given reason for your answer. sleeping, cycling, brisk walk, watching T.V
Performance based graph) The given graph shows the total runs scored by two batmans P and Q during each of the five different matches in the year 2011. study the graph and answer the following questions : What information is given on the axes?
The graph below shows how the force on a mass depends on the position of the mass. What is the change in the kinetic energy of the mass as it moves from x=0.0m to x=3.0 m ?
The graph given below shows how the force on a mass depends on the position of the mass. What is the change in the kinetic energy of the mass as it moves from x=0.0m to x=3.0m ?
The graph given alongside shows how the speed of a car changes with time : (i) What is the initial speed of the car ? ltBrgt (ii) What is the maximum speed attained by the car ? ltBrgt (iii) Which part of the graph shows zero acceleration ? ltBrgt (iv) Which part of the graph shows varying retardation ? (v) Find the distance travelled in first 8 hours.
The given graph shows how much nitrate (NO_(3)^(-)) is exported from the continent towards the ocean by 16 major rivers in the world rivers in the world compared to the density of human populations living along those drainage basins (i.e., along these rivers). What interpretation can be drawn from this graph ?
SCIENCE OLYMPIAD FOUNDATION -NSO QUESTION PAPER 2017- 18 SET - B-ACHIEVERS SECTION