A
B
C
D
Text Solution
Verified by Experts
The correct Answer is:


Topper's Solved these Questions
Similar Questions
Explore conceptually related problems
SCIENCE OLYMPIAD FOUNDATION -NSO QUESTION PAPER 2017- 18 SET - B-SCIENCE
- Shruti tested the nature of a few common substances with the help of s...
Text Solution
|
- Refer to the given pic diagram representing composition of soil. Sel...
Text Solution
|
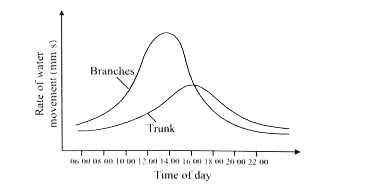
- The given graph shows rate of water movement through trunk and branche...
Text Solution
|
- The given graph shows changes in pH of water in an undisturbed freshwa...
Text Solution
|
- Refer to the given pie chart representing the composition of air. Wh...
Text Solution
|