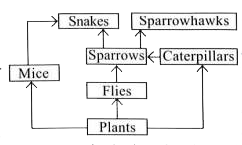
Refer to the given food web operating in a community. Large amount of insecticides was sprayed in this community. Which of the following graphs correctly depicts the changes in numbers of mice, caterpillars and sparrowhawks over time?
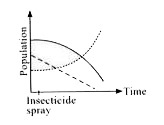
A
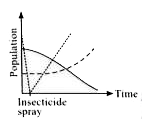
B
C
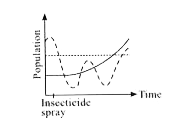
D
Text Solution
Verified by Experts
The correct Answer is:
D
In the given food web, on application of insecticide, the populations of flies and caterpillars will be drastically reduced or demolished. Due to which number of plants will increase. Due to increase in number of plants, number of mice will also increase. Population of snakes, sparrows and sparrowhawks will also reduce as less food will be available to them.
Topper's Solved these Questions
NSO QUESTION PAPER 2017- 18 SET - B
SCIENCE OLYMPIAD FOUNDATION |Exercise ACHIEVERS SECTION|2 Videos
NSO MODEL TEST PAPER 03
SCIENCE OLYMPIAD FOUNDATION |Exercise ACHIEVERS SECTION|3 Videos
NSO QUESTION PAPER 2017-18 SET A
SCIENCE OLYMPIAD FOUNDATION |Exercise SCIENCE|19 Videos
Similar Questions
Explore conceptually related problems
100 mL of 0.1 HCl is taken in a beaker and to it 100 mL of 0.1 M NaOH is added in steps of 2ml and the pH is continuously measured . Which of the following graphs correctly depicts the change in pH
100 g of ice at -15^@C was heated. The rise in temperature of ice was plotted against the heat given to ice. Which of the following graphs (Fig. 6.2) correctly depicts this behaviour?
Shivani took three equal sized similar glasses X, Y and Z and filled each of them with 20 mL of water. She left glass X in the sun and covered it with plate, placed glass Y in shade and placed glass Z in the sun. Which of the given graphs correctly represents change in amount of water in glasses X. Y and Z with time?
The graph given above indicates change in temperature (Delta t) when heat (Q) was given to a substance. Which among the following parts of the graph correctly depict the latent heat of the substance?
Which of the following graph corresponds to a population of 2000 individuals, with 800 births and 1200 deaths over a given period of time?
In a given population of 2000 indivials, 80 births and 125 deaths were reported over a given period of time. Which of the following graphs will correspond to it ?
A glass tumbler containing hot water is kept in the freezer compartment of a refrigerator (temperature lt 0^(@) C ). If you could measure the temperature of the content of the tumbler , which of the following graphs would correctly represent the change in its temperature as a function of time.
SCIENCE OLYMPIAD FOUNDATION -NSO QUESTION PAPER 2017- 18 SET - B-ACHIEVERS SECTION