Home
Class 12
BIOLOGY
Analyse the following given pie chart an...

Analyse the following given pie chart and answer the questions based on it.

What conclusion can be derived from graph 1?

Text Solution

Verified by Experts

As according to the graph, there is maximum population of plants as compared to animals that comprise of 70 percent of the total species population.
Promotional Banner

Similar Questions

Explore conceptually related problems

Study the following graph and answer the question based on the graph. What was the percentage decline in the production from Friday to Saturday?

Observe the pie chart given below and answer questions based on it. Which colour received 1/5 of the votes?

Study the given pie chart carefully and answer the question based on it. Below pie chart given the expenditure (in percentage) on various items and savings of a family during a month. Expenditure on which item is equal to the total savings of the family?

Study the given pie chart carefully and answer the question based on it. Pie chart show below gives the expenditure (in percentage) on various items and savings of a family during a month. On which item, the expenditure was minimum ?

Study the given pie chart carefully and answer the question based on it. Pie chart show below gives the expenditure (in percentage) on various items and savings of a family during a month. Expenditure on which item is equal to the total savings of the family ?

Study the given pie chart carefully and answer the question based on it. Below pie chart given the expenditure (in percentage) on various items and savings of a family during a month. If the monthly savings of the family is Rs 3000, what is the monthly expenditure on clothes?

Study the given pie chart carefully and answer the question based on it. Pie chart show below gives the expenditure (in percentage) on various items and savings of a family during a month. If the monthly savings of the family is Rs 3000. what is the monthly expenditure on clothes

The following pie-chart shows the percentage distribution of the expenditure incurred in publishing a book. Study the pie-chart and answer the questions based on it. What is the central angle of the sector corresponding to the expenditure incurred on binding?

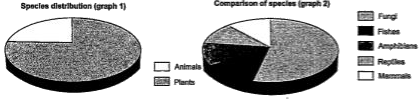
Directions (Q. Nos. 1 - 5) Study the following graph and pie chart carefully and answer the Questions that follow. . What is the total number of males in all the organisations together?