Text Solution
Verified by Experts


Similar Questions
Explore conceptually related problems
Recommended Questions
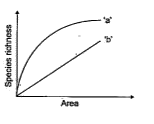
- The graph given below shows the species-area relationship. Answer the ...
Text Solution
|
- Assertion : If the species-area relationship are analysed among very l...
Text Solution
|
- The following graph shows the species area relationship. Answers the Q...
Text Solution
|
- The given graph shows species-area relationship. Write the equation of...
Text Solution
|
- The above graph show Species-Area relationship. Write the equation of ...
Text Solution
|
- अभिकथन : यदि जातीय-क्षेत्र संबंध की गणना बहुत बड़े आकार के क्षेत्र में...
Text Solution
|
- The following graph shows the species area relationship. Answers the Q...
Text Solution
|
- The following graph shows the species area relationship. Answers the Q...
Text Solution
|
- The above graph show Species-Area relationship. Write the equation of ...
Text Solution
|