Text Solution
Verified by Experts


Similar Questions
Explore conceptually related problems
Recommended Questions
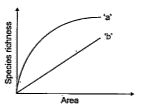
- The graph given below shows the species-area relationship. Answer the ...
Text Solution
|
- A species area curve is drawn by plotting the number of species agains...
Text Solution
|
- The following graph shows the species area relationship. Answers the Q...
Text Solution
|
- The given graph shows species-area relationship. Write the equation of...
Text Solution
|
- If we analyse the species-area relationships among very large areas li...
Text Solution
|
- A species area curve is drawn by plotting the number of species agains...
Text Solution
|
- The following graph shows the species area relationship. Answers the Q...
Text Solution
|
- The following graph shows the species area relationship. Answers the Q...
Text Solution
|
- A species-area curve is drawn by plotting the number of species agains...
Text Solution
|