Text Solution
Verified by Experts


Similar Questions
Explore conceptually related problems
Recommended Questions
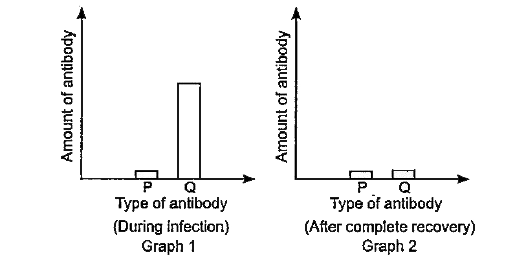
- The given graphs show the amount of different antibodies Pand Q in the...
Text Solution
|
- From the given v - t graph (Figure), it can be inferred that the objec...
Text Solution
|
- From the given v-t graph (see figure), it can be inferred that the obj...
Text Solution
|
- The graph shows the variation of displacement of a particle executing ...
Text Solution
|
- Assertion: AIDS spreads by contact between the blood of an infected pe...
Text Solution
|
- Figure shows a graph of potential energy. Consider the following graph...
Text Solution
|
- Draw a graph showing the variation of binding energy per nucleon with ...
Text Solution
|
- From the given v-t graph (see figure), it can be inferred that the obj...
Text Solution
|
- From the given v-t graph it can be inferred that an object is
Text Solution
|