Text Solution
Verified by Experts


Similar Questions
Explore conceptually related problems
Recommended Questions
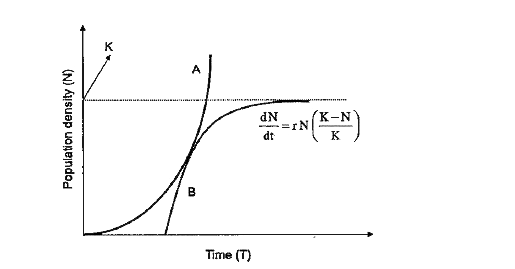
- Analyse the graph given below and answer the questions based on it? ...
Text Solution
|
- वेग स्थिरांक (rate constant) (K) तथा ताप (T) में खींचे गए ग्राफ नीचे...
Text Solution
|
- If the equation of line A shown on the graph is given by y=mx+b, and t...
Text Solution
|
- Question 1 and 2 refer to the information and graph below. Let funct...
Text Solution
|
- Observe the following graph and answer the questions given below . Wha...
Text Solution
|
- Answer the following based on the graph given below. What is the ma...
Text Solution
|
- Answer the following based on the graph given below. what is the ma...
Text Solution
|
- Answer the following based on the graph given below. What is the frequ...
Text Solution
|
- Analyse the graph and answer the following questions. Name the patho...
Text Solution
|