Text Solution
Verified by Experts


Similar Questions
Explore conceptually related problems
Recommended Questions
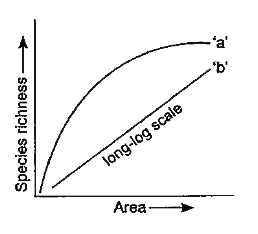
- The graph given alongside shows the species area relationship. Study t...
Text Solution
|
- The following graph shows the species area relationship. Answers the Q...
Text Solution
|
- The given graph shows species-area relationship. Write the equation of...
Text Solution
|
- The above graph show Species-Area relationship. Write the equation of ...
Text Solution
|
- Study the graph and answer the following questions: Graph showing e...
Text Solution
|
- The following graph shows the species area relationship. Answers the Q...
Text Solution
|
- The following graph shows the species area relationship. Answers the Q...
Text Solution
|
- The above graph show Species-Area relationship. Write the equation of ...
Text Solution
|
- Who explored the species area relationship ?
Text Solution
|