Text Solution
Verified by Experts


Similar Questions
Explore conceptually related problems
Recommended Questions
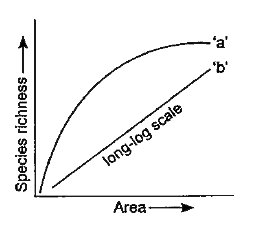
- The graph given alongside shows the species area relationship. Study t...
Text Solution
|
- Assertion : If the species-area relationship are analysed among very l...
Text Solution
|
- The following graph shows the species area relationship. Answers the Q...
Text Solution
|
- Study the above graph and answer the following questions - (i) Identif...
Text Solution
|
- The given graph shows species-area relationship. Write the equation of...
Text Solution
|
- The above graph show Species-Area relationship. Write the equation of ...
Text Solution
|
- The following graph shows the species area relationship. Answers the Q...
Text Solution
|
- The following graph shows the species area relationship. Answers the Q...
Text Solution
|
- The above graph show Species-Area relationship. Write the equation of ...
Text Solution
|