Text Solution
Verified by Experts


Similar Questions
Explore conceptually related problems
Recommended Questions
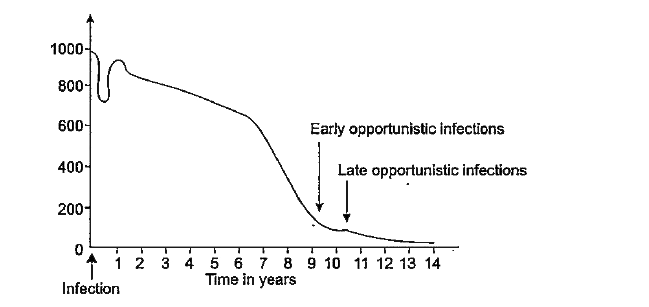
- The graph in figure below shows how the number of X cells typically de...
Text Solution
|
- Study the following graph carefully and answer the questions that ...
Text Solution
|
- Study the following graph carefully and answer the questions that foll...
Text Solution
|
- The following graph shows the production of wheat flour (in 1000 tonne...
Text Solution
|
- The graph shows Income and Expenditure of a company. Study the graph a...
Text Solution
|
- The following bar graph shows the games played by the students. Study ...
Text Solution
|
- Study the following graph and answer the questions given below it. Wha...
Text Solution
|
- Study the following graph and answer the questions given below it. In ...
Text Solution
|
- A graph showing the price of rice in India during the year 2000 to 200...
Text Solution
|