Home
Class 12
BIOLOGY
The graph shows the level of antibody in...

The graph shows the level of antibody in serum following vaccination and a challenge with the same antigen 28 days later.
Study the graphs below and answer the question:

What does peak A represents?

Text Solution

Verified by Experts

Level of IgM only. In a primary immune response, naive B cells are stimulated by antigen, become activated, and differentiate into antibody-secreting cells that produce antibodies specific for the eliciting antigen. A large amount of IgM and a small amount of IgG are produced during the primary immune response.
Promotional Banner

Similar Questions

Explore conceptually related problems

Study the diagram and answer the following questions What does the diagram represent?

Study the bar graph and answer the following questions. Which is the most popular sport ?

Study the bar graph and answer the following questions. Which sport is preferred least ?

The following bar graph shows the games played by the students. Study the graph carefully and answer the question given below: How many students play table tennis?

The following graph shows the sales of cars (in thousands) in four cities in 4 years. Study the graph and answer the question In which year. the sales are highest?

The following graph shows the sales of cars (in thousands) in four cities in 4 years. Study the graph and answer the question. Which city has the highest sales?

Recommended Questions
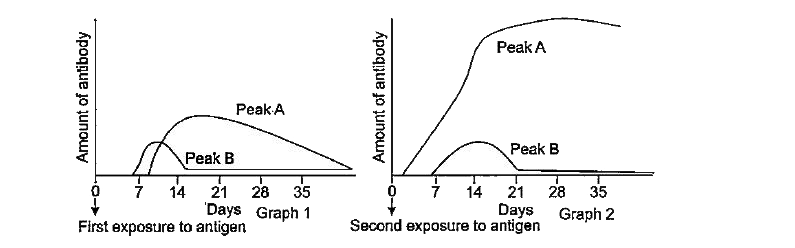
  1. The graph shows the level of antibody in serum following vaccination a...

    Text Solution

    |

  2. The first antibody to appear in the serum following stimulation by ant...

    Text Solution

    |

  3. बार ग्राफ का अध्ययन कीजिए और निम्नलिखित प्रश्नों के उत्तर दीजिए। ग्राफ...

    Text Solution

    |

  4. बार ग्राफ का अध्ययन कीजिए और निम्नलिखित प्रश्नों के उत्तर दीजिए। ग्राफ...

    Text Solution

    |

  5. बार ग्राफ का अध्ययन कीजिए और निम्नलिखित प्रश्नों के उत्तर दीजिए। ग्राफ...

    Text Solution

    |

  6. बार ग्राफ का अध्ययन कीजिए और निम्नलिखित प्रश्नों के उत्तर दीजिए। ग्राफ...

    Text Solution

    |

  7. ग्राफ में किसी कम्पनी के मासिक व्यय को दर्शाया गया है। ग्राफ का अध्ययन...

    Text Solution

    |

  8. ग्राफ में किसी कम्पनी के मासिक व्यय को दर्शाया गया है। ग्राफ का अध्ययन...

    Text Solution

    |

  9. a. What does the graph represent ? b.What is the importance of this gr...

    Text Solution

    |