Text Solution
Verified by Experts


Similar Questions
Explore conceptually related problems
Recommended Questions
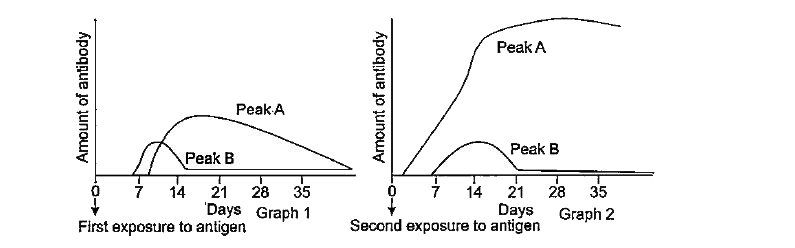
- The graph shows the level of antibody in serum following vaccination a...
Text Solution
|
- Refer to the given graph carefully and answer the following question. ...
Text Solution
|
- बार ग्राफ का अध्ययन कीजिए और निम्नलिखित प्रश्नों के उत्तर दीजिए। ग्राफ...
Text Solution
|
- ग्राफ में किसी कम्पनी के मासिक व्यय को दर्शाया गया है। ग्राफ का अध्ययन...
Text Solution
|
- ग्राफ में किसी कम्पनी के मासिक व्यय को दर्शाया गया है। ग्राफ का अध्ययन...
Text Solution
|
- ग्राफ में किसी कम्पनी के मासिक व्यय को दर्शाया गया है। ग्राफ का अध्ययन...
Text Solution
|
- If the accomanying figure above shows the graph of function f, which o...
Text Solution
|
- Study the following graph carefully and answer the questions that foll...
Text Solution
|
- The graph shows Income and Expenditure of a company. Study the graph a...
Text Solution
|