Text Solution
Verified by Experts


Similar Questions
Explore conceptually related problems
Recommended Questions
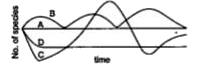
- The given graph represents the environment in the graph. Which from th...
Text Solution
|
- The given graph shows the variation of velocity with displacement. Whi...
Text Solution
|
- Graphs are very useful to represent a physical situation. Various quan...
Text Solution
|
- दिये गये सभी ग्राफ एक ही गति को दर्शाते हैं । कोई एक ग्राफ उस गति को ...
Text Solution
|
- You are given two graphs. What conclusion do you draw from the graphs?
Text Solution
|
- f(x)+2=0 ধ্রুবক অপেক্ষক গুলির লেখচিত্র অঙ্কন করাে এবং প্রতিক্ষেত্রে লে...
Text Solution
|
- f(x)=0 ধ্রুবক অপেক্ষক গুলির লেখচিত্র অঙ্কন করাে এবং প্রতিক্ষেত্রে লেখচ...
Text Solution
|
- f(x)-3=0 ধ্রুবক অপেক্ষক গুলির লেখচিত্র অঙ্কন করাে এবং প্রতিক্ষেত্রে লে...
Text Solution
|
- दिये गये ग्राफ में विस्थापन के सापेक्ष वेग के परिवर्तन को दिखाया गया ह...
Text Solution
|