A
B
C
D
Text Solution
Verified by Experts
The correct Answer is:


Topper's Solved these Questions
NEWTON'S LAWS OF MOTION
ERRORLESS|Exercise ASSERTION & REASON |18 VideosNEWTON'S LAWS OF MOTION
ERRORLESS|Exercise NCERT BASED QUESTION (MOTION OF CONNECTED BODIES)|22 VideosMOTION IN TWO DIMENSION
ERRORLESS|Exercise ASSERTION & REASON|19 VideosROTATIONAL MOTION
ERRORLESS|Exercise Assertion & Reason|25 Videos
Similar Questions
Explore conceptually related problems
ERRORLESS-NEWTON'S LAWS OF MOTION-PAST YEARS QUESTIONS
- A person holds a spring balance with a mass m hanging from it goes up ...
Text Solution
|
- A person is standing in an elevator. In which situation he finds his w...
Text Solution
|
- A person used force (F) , shown in figure to move a load with constant...
Text Solution
|
- A man is standing on a sparing platform, Reading of spring balaance is...
Text Solution
|
- A body, whose momentum is constant, must have constant
Text Solution
|
- An explosion blows a rock into three parts. Two parts go off at right ...
Text Solution
|
- Rocket engines lift a rocket from the earth surface because hot gas wi...
Text Solution
|
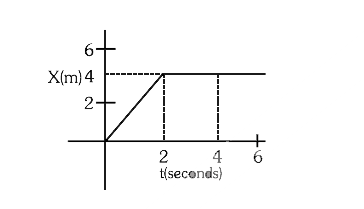
- In the figure given below, the position–time graph of a particle of ma...
Text Solution
|
- A riding ball of mass m strikes a rigid wall at 60^(@) and gets reflec...
Text Solution
|
- A block of mass m is placed on a smooth inclined wedge ABC of inclinat...
Text Solution
|
- A particle moving with velocity vecV is acted by the three forces show...
Text Solution
|
- Three blocks with masses m , 2m and 3m are connected by strings, as sh...
Text Solution
|
- Two blocks A and B of masses 2m and respectively, are connected by a ...
Text Solution
|
- Two bodies of mass 4 kg and tied to the ends of a massless string. the...
Text Solution
|