A
B
C
D
Text Solution
Verified by Experts
The correct Answer is:


Topper's Solved these Questions
TRANSMISSION OF HEAT
ERRORLESS|Exercise NCERT BASED QUESTIONS (Radiation (Stefan.s law))|25 VideosTRANSMISSION OF HEAT
ERRORLESS|Exercise NCERT BASED QUESTIONS (Radiation (Newton.s Law of Cooling))|11 VideosTRANSMISSION OF HEAT
ERRORLESS|Exercise NCERT BASED QUESTIONS (Radiation (General,Kirchhoff.s law,Black body))|14 VideosTHERMOMETRY, THERMAL EXPANSION AND CALORIMETRY
ERRORLESS|Exercise ASSERTION & REASON|10 VideosUNITS, DIMENSIONS AND MEASUREMENT
ERRORLESS|Exercise ASSERTION & REASON |17 Videos
Similar Questions
Explore conceptually related problems
ERRORLESS-TRANSMISSION OF HEAT -NCERT BASED QUESTIONS (Radiation (Wien.s law))
- According to Wien ,s law
Text Solution
|
- The colour of a star indicates its
Text Solution
|
- Temperature of the star is determined by
Text Solution
|
- If wavelengths of maximum intensity of radiations emitted by the sun a...
Text Solution
|
- The wavelength lamdam=5.5 xx10^(-7) m when the temperature of the sun...
Text Solution
|
- The intensity of radiation emitted by the sun has its maximum value at...
Text Solution
|
- A black body emits radiations of maximum intensity at a wavelength of ...
Text Solution
|
- The wavelength of maximum energy released during an atomic explosion w...
Text Solution
|
- The maximum wavelength of radiation at 2000 K is 4mum. What will be th...
Text Solution
|
- A black body has maximum wavelength lambda(m) at temperature 2000 K. I...
Text Solution
|
- The maximum energy in thermal radiation from a source occurs at the wa...
Text Solution
|
- A container is divided into two equal part I and II by a partition wit...
Text Solution
|
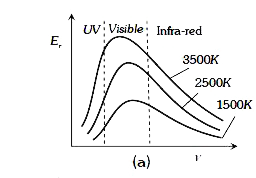
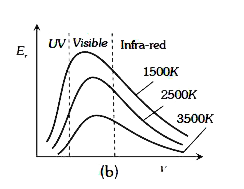
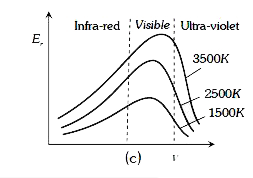
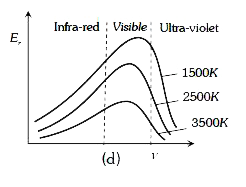
- Which of the following graph(s) shows the correct variation in intensi...
Text Solution
|