A
B
C
D
Text Solution
Verified by Experts
The correct Answer is:


Topper's Solved these Questions
KINETIC THEORY OF GASES
ERRORLESS|Exercise NCERT BASED QUESTIONS (Speed of Gas)|24 VideosKINETIC THEORY OF GASES
ERRORLESS|Exercise NCERT BASED QUESTIONS (Degree of Freedom and Specific Heat)|30 VideosGRAVITATION
ERRORLESS|Exercise Assertion and Reason |25 VideosMOTION IN ONE DIMENSION
ERRORLESS|Exercise ASSERTION AND REASON|24 Videos
Similar Questions
Explore conceptually related problems
ERRORLESS-KINETIC THEORY OF GASES -ASSERTION AND REASON
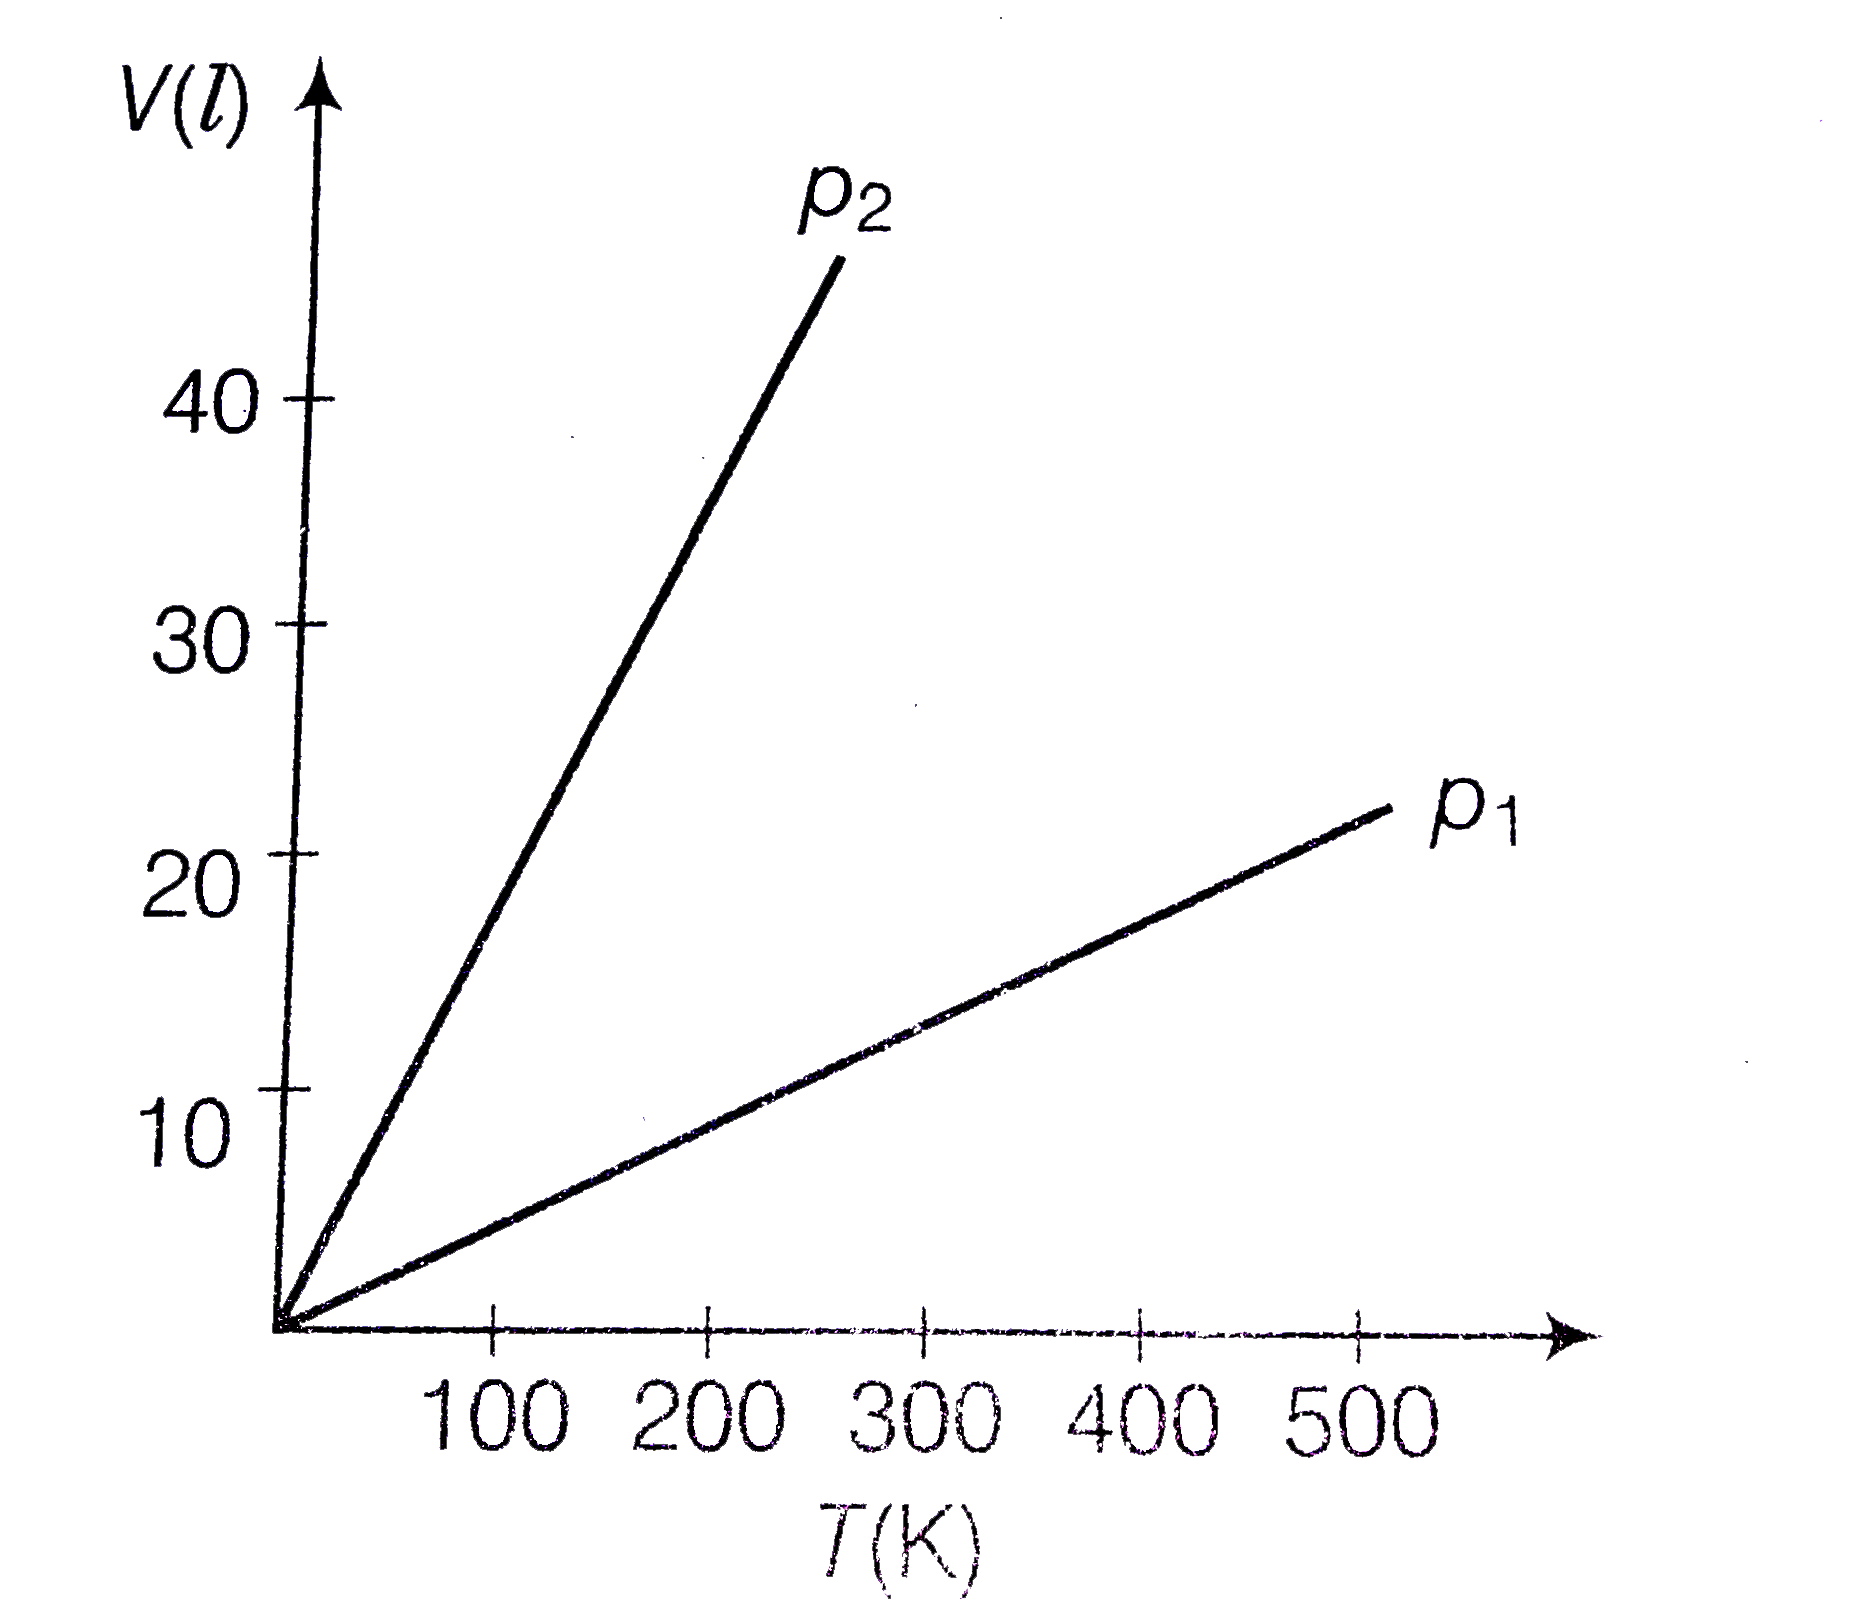
- Volume versus temperature graphs for a given mass of an ideal gas are ...
Text Solution
|
- Assertion : In pressure-temperature (P-T) phase diagram of water, the ...
Text Solution
|
- Assertion : For gas atom the number of degrees of freedom is 3. R...
Text Solution
|
- Assertion : A gas have a unique value of specific heat. Reason : ...
Text Solution
|
- Assertion : A gas can be liquified at any temperature by increase of ...
Text Solution
|
- Assetion : Equal masses of helium and oxygen gases are given equal qua...
Text Solution
|
- Assertion : Absolute zero is the temperature corresponding to zero en...
Text Solution
|
- Assertion : The ratio C(P)// C(upsilon) for a diatomic gas is more tha...
Text Solution
|
- Assertion : Mean free path of a gas molecule varies inversely as densi...
Text Solution
|
- Assetion : Specific heat of a gas at constant pressure is greater than...
Text Solution
|
- Assertion : The internal energy of a real gas is function of both, t...
Text Solution
|
- Assertion : For an ideal gas, at constant temperature, the product of...
Text Solution
|
- Assertion : If a gas container in motion is suddenly stopped, the temp...
Text Solution
|
- Assertion : Internal energy of an ideal gas does not depend upon volum...
Text Solution
|
- Assertion : Air pressure in a car tyre increase during driving. Reas...
Text Solution
|
- Statement-1 : Maxwell speed distribution graph is asymmetric about ...
Text Solution
|
- Assertion : The root mean sguar and most probable speed of the molecul...
Text Solution
|