


Topper's Solved these Questions
QUESTION PAPER 2022 TERM 2 SET 3 STANDARD
X BOARDS|Exercise SECTION C|7 VideosQUESTION PAPER 2022 TERM 2 SET 3 STANDARD
X BOARDS|Exercise SECTION C|7 VideosQUESTION PAPER 2022 TERM 2 SET 2 STANDARD
X BOARDS|Exercise SECTION C|7 VideosQUESTION PAPER 2022 TERM 2 SET 4 STANDARD
X BOARDS|Exercise QUESTION|20 Videos
Similar Questions
Explore conceptually related problems
X BOARDS-QUESTION PAPER 2022 TERM 2 SET 3 STANDARD-SECTION B
- Determine the median marks for the following data:
Text Solution
|
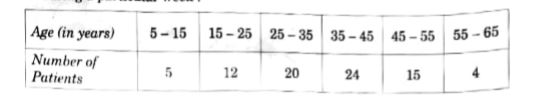
- The following table shows the age of patients admitted in a hospital d...
Text Solution
|
- Draw a circle of radius 1 cm. Construct a pair of tangents to the circ...
Text Solution
|
- Draw a line segment PQ = 7.5 cm. Divide it in the ratio 3: 1.
Text Solution
|
- A tower stands vertically on the ground. From a point on the ground, ...
Text Solution
|