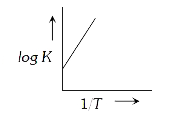
A
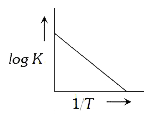
B
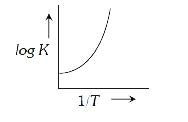
C
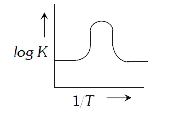
D
Text Solution
Verified by Experts
The correct Answer is:


Topper's Solved these Questions
CHEMICAL KINETICS
ERRORLESS|Exercise NCERT BASED QUESTIONS (Photochemical Reaction)|4 VideosCHEMICAL KINETICS
ERRORLESS|Exercise NCERT BASED QUESTIONS (Graphical Questions)|7 VideosCHEMICAL KINETICS
ERRORLESS|Exercise NCERT BASED QUESTIONS (Rate Law and Rate Constant)|106 VideosCARBOXYLIC ACIDS
ERRORLESS|Exercise Assertion & Reason|5 VideosCHEMISTRY IN EVERYDAY LIFE
ERRORLESS|Exercise Assertion & Reason|4 Videos
Similar Questions
Explore conceptually related problems
ERRORLESS-CHEMICAL KINETICS-NCERT BASED QUESTIONS (Collision Theory, Energy of Activation and Arrhenius Equation)
- ARRHENIUS THEORY
Text Solution
|
- The Arrhenius equation expressing the effect of temperature on the rat...
Text Solution
|
- The rate constant of a reaction at temperature 200 K is 10 times less ...
Text Solution
|
- In respect of the equation k=Ae^(-E(a)//RT) in chemical kinetics, whic...
Text Solution
|
- Activation energy (E(a)) and rate constants (k(1) and k(2)) of a chemi...
Text Solution
|
- The specific rate constant for a reaction increases by a factor of 4, ...
Text Solution
|
- The rate temperature changes from 300K to 310K. Activation energy of s...
Text Solution
|
- The activation energy of a reaction can be determined from the slope o...
Text Solution
|
- The temperature dependence of rate constant (k) of a chemical reaction...
Text Solution
|
- A reaction rate constant is given by k = 1.2 xx 10^(14) e^((-2500)/(...
Text Solution
|
- In the Arrhenius plot of ln k vs (1)/(T) , a linear plot is obtained w...
Text Solution
|
- For a reaction taking place in three steps, the rate consatnt are k(1)...
Text Solution
|
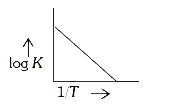
- A graph plotted between log k versus 1//T for calculating activation e...
Text Solution
|
- Activation energy of a chemical reaction can be determined by
Text Solution
|
- Consider the Arrhenius equation given below and mark the correct op...
Text Solution
|
- A given sample of milk turns sour at room temperature (27^(@)C) in fiv...
Text Solution
|
- Increasing the temperature increases the rate of reaction but does...
Text Solution
|
- The rate of a chemical reaction generally increases rapidly even for s...
Text Solution
|
- The rate constant of a chemical reaction at a very high temperature wi...
Text Solution
|
- A reaction has an activation energy of 209 KJ "mol"^(-1) . The rate in...
Text Solution
|