A
B
C
D
Text Solution
AI Generated Solution
The correct Answer is:


Topper's Solved these Questions
CHEMICAL KINETICS
ERRORLESS|Exercise PAST YEARS QUESTIONS|51 VideosCHEMICAL KINETICS
ERRORLESS|Exercise Assertion & Reason|6 VideosCHEMICAL KINETICS
ERRORLESS|Exercise NCERT BASED QUESTIONS (Photochemical Reaction)|4 VideosCARBOXYLIC ACIDS
ERRORLESS|Exercise Assertion & Reason|5 VideosCHEMISTRY IN EVERYDAY LIFE
ERRORLESS|Exercise Assertion & Reason|4 Videos
Similar Questions
Explore conceptually related problems
ERRORLESS-CHEMICAL KINETICS-NCERT BASED QUESTIONS (Graphical Questions)
- Rate law of the n^(th) order reaction is given by (dx)/(dt)=k[A]^(n) ...
Text Solution
|
- Rate constant k of the first order reaction is given by k=(2.303)/(t)l...
Text Solution
|
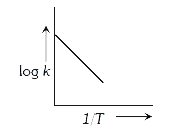
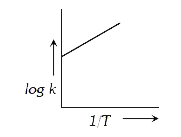
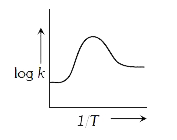
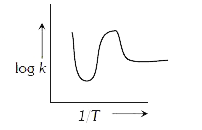
- Rate constant k varies with temperature T(k) as given by equation lo...
Text Solution
|
- EMF of a cell is related to standard EMF,E^(@) by the equation E=E^(...
Text Solution
|
- For a reation: A rarr Product, rate law is -(d[A])/(dt)=K[A](0). T...
Text Solution
|
- Following equation gives variation of equilibrium constant k with temp...
Text Solution
|
- A bacterial infection in an internal wound grows as N'(t) = N(0) exp (...
Text Solution
|