


Topper's Solved these Questions
QUESTION PAPER 2022 SET-1
XII BOARDS PREVIOUS YEAR|Exercise Section-C|5 VideosQUESTION PAPER 2022 SET-1
XII BOARDS PREVIOUS YEAR|Exercise Section-C|5 VideosEXAM REVISION SERIES
XII BOARDS PREVIOUS YEAR|Exercise All Questions|32 VideosQUESTION PAPER 2022 SET-2
XII BOARDS PREVIOUS YEAR|Exercise SECTION C|2 Videos
Similar Questions
Explore conceptually related problems
XII BOARDS PREVIOUS YEAR-QUESTION PAPER 2022 SET-1-Section-B
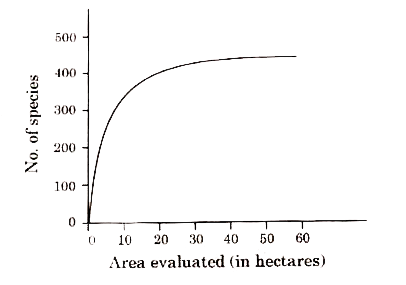
- The graph given below shows species-area-relationship of a certain reg...
Text Solution
|
- The graph given below shows species-area-relationship of a certain reg...
Text Solution
|
- How did Dr. David Tilman relate experimentally, the stability of a com...
Text Solution
|
- What are the consequences of loss of biodiversity in a region? Explain
Text Solution
|
- Bacillus thuringiensis plays an important n Integrated Pest Management...
Text Solution
|
- With the help of a storyboard or a flowchart only, explain all the sta...
Text Solution
|
- Explain the roles of (1) primary, and (ii) secondary lymphoid organs t...
Text Solution
|
- Doctors generally advise not to undergo surgery of tonsils. Why?
Text Solution
|
- Causative agents of HIV-AIDS and COVID-19 belong to the same group of ...
Text Solution
|
- Causative agents of HIV-AIDS and COVID-19 belong to the same group of ...
Text Solution
|