


Topper's Solved these Questions
QUESTION PAPER 2022 SET-3
XII BOARDS PREVIOUS YEAR|Exercise SECTION B|9 VideosQUESTION PAPER 2022 SET-3
XII BOARDS PREVIOUS YEAR|Exercise SECTION C|8 VideosQUESTION PAPER 2022 SET-2
XII BOARDS PREVIOUS YEAR|Exercise SECTION C|2 VideosQUESTION PAPER 2022 TERM 1 SET 1
XII BOARDS PREVIOUS YEAR|Exercise SECTION-C|12 Videos
Similar Questions
Explore conceptually related problems
XII BOARDS PREVIOUS YEAR-QUESTION PAPER 2022 SET-3-SECTION C
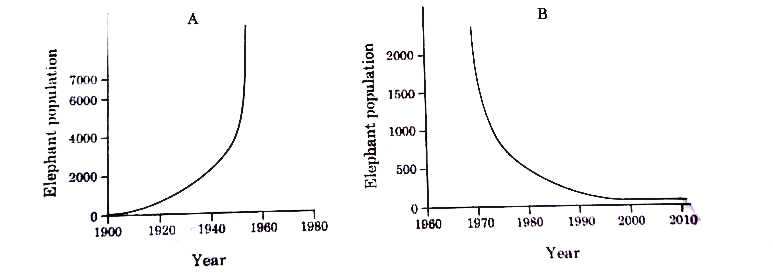
- The graphs given below, A and B, represent population of elephants in ...
Text Solution
|
- There are two different farm lands, one where Bt-cotton crop was culti...
Text Solution
|
- There are two different farm lands, one where Bt-cotton crop was culti...
Text Solution
|
- There are two different farm lands, one where Bt-cotton crop was culti...
Text Solution
|
- Gene of interest/alien gene is introduced by a cloning vector into a h...
Text Solution
|
- Gene of interest/alien gene is introduced by a cloning vector into a h...
Text Solution
|
- Gene of interest/alien gene is introduced by a cloning vector into a h...
Text Solution
|
- Gene of interest/alien gene is introduced by a cloning vector into a h...
Text Solution
|
- Gene of interest/alien gene is introduced by a cloning vector into a h...
Text Solution
|