


Topper's Solved these Questions
QUESTION PAPER 2022 SET-3
XII BOARDS PREVIOUS YEAR|Exercise SECTION C|8 VideosQUESTION PAPER 2022 SET-3
XII BOARDS PREVIOUS YEAR|Exercise SECTION C|8 VideosQUESTION PAPER 2022 SET-2
XII BOARDS PREVIOUS YEAR|Exercise SECTION C|2 VideosQUESTION PAPER 2022 TERM 1 SET 1
XII BOARDS PREVIOUS YEAR|Exercise SECTION-C|12 Videos
Similar Questions
Explore conceptually related problems
XII BOARDS PREVIOUS YEAR-QUESTION PAPER 2022 SET-3-SECTION B
- How are the advanced ex-situ techniques helping in conserving threaten...
Text Solution
|
- With the help of a storyboard or a flowchart only, explain all the sta...
Text Solution
|
- Explain the roles of (1) primary, and (ii) secondary lymphoid organs t...
Text Solution
|
- Doctors generally advise not to undergo surgery of tonsils. Why?
Text Solution
|
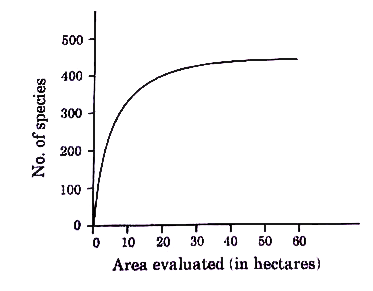
- The graph given below shows species-area relationship of a certain reg...
Text Solution
|
- The graph given below shows species-area relationship of a certain reg...
Text Solution
|
- How did Dr. David Tilman relate experimentally, the stability of a com...
Text Solution
|
- Bacillus thuringiensis plays an important role in Integrated Pest Mana...
Text Solution
|
- Only with the help of a labelled diagram, show the steps of formation ...
Text Solution
|