A
B
C
D
Text Solution
Verified by Experts
The correct Answer is:


Similar Questions
Explore conceptually related problems
Recommended Questions
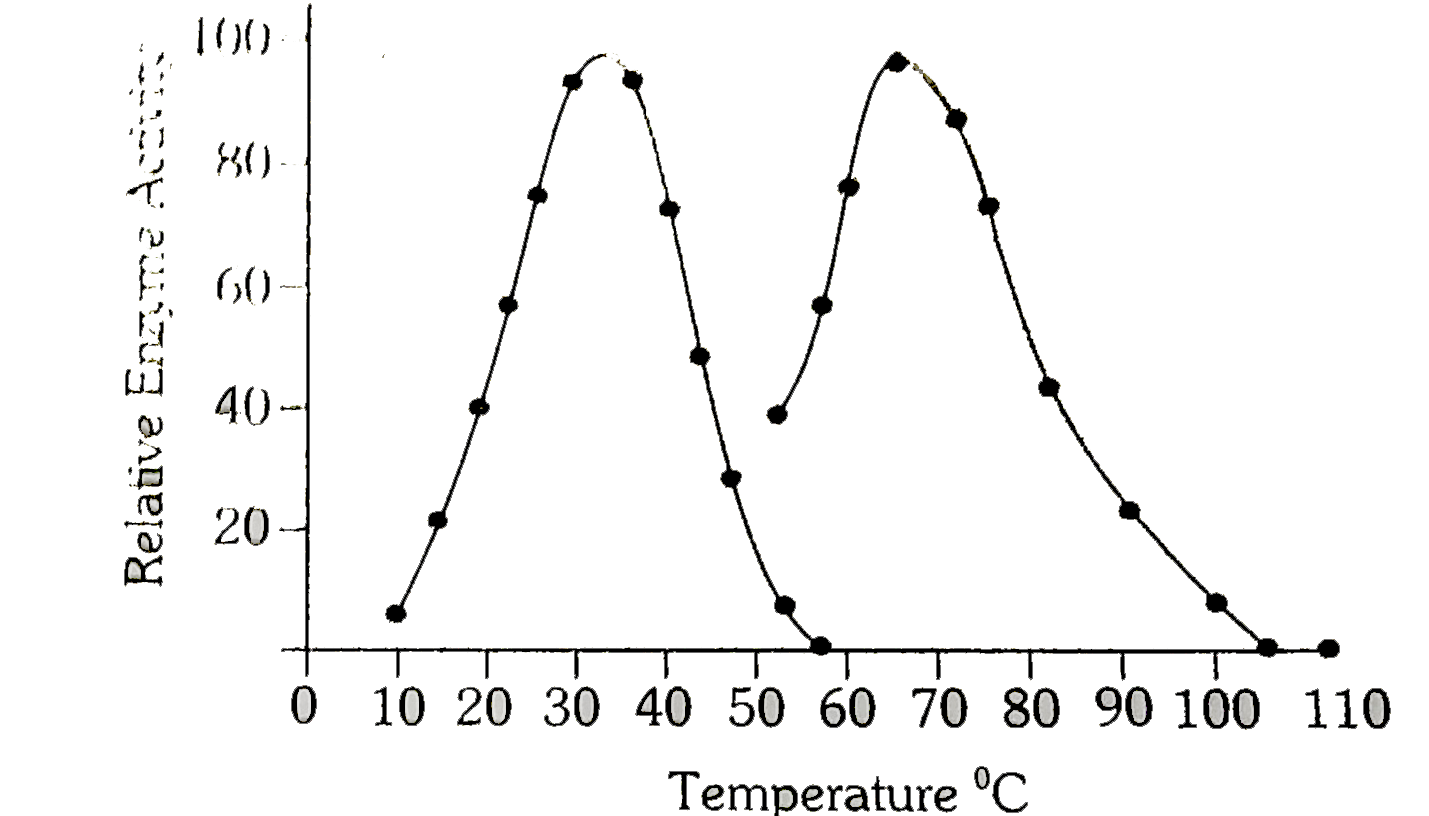
- The given graph depicts the effect of temperature on the activity of t...
Text Solution
|
- Refer to the given graph showing relationship between temperature and ...
Text Solution
|
- The given graph depicts the effect of temperature on the activity of t...
Text Solution
|
- Read the following : (a) Low temperature preserves the enzyme (b) ...
Text Solution
|
- Rate of a reaction increases by 10^6 times when a reaction is carried ...
Text Solution
|
- Which of the following set is having correct statements for enzyme cat...
Text Solution
|
- In experiment to study fermentation by yeast, temperature was increase...
Text Solution
|
- Rate of a reaction increases by 10^6 times when a reaction is carried ...
Text Solution
|
- Refer to the given graph showing relationship between temperature and ...
Text Solution
|