A
B
C
D
Text Solution
Verified by Experts
The correct Answer is:


Similar Questions
Explore conceptually related problems
Recommended Questions
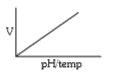
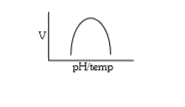
- Which graph represents the effect of pHk/temp on the velocity of a typ...
Text Solution
|
- The graph below shws the velocity versus time graph for a body Wh...
Text Solution
|
- Which one of the given graphs shows the effect of pH on the velocity o...
Text Solution
|
- Which one of the given graphs shows the effect of temperature on the v...
Text Solution
|
- Which graph represents the effect of pHk/temp on the velocity of a typ...
Text Solution
|
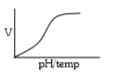
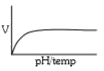
- With the increase in substrate concentration, the velocity of the enzy...
Text Solution
|
- निम्न में से कौन सा ग्राफ एक प्रारूपिक एन्जाइम अभिक्रिया के वेग (V) पर...
Text Solution
|
- दिये गये ग्राफ में से कौन सा एक प्रारूपिक एन्जाइम अभिक्रिया के वेग पर ...
Text Solution
|
- Which one of the given graphs shows the effect of temperature on the v...
Text Solution
|