A
B
C
D
Text Solution
Verified by Experts
The correct Answer is:


Similar Questions
Explore conceptually related problems
Recommended Questions
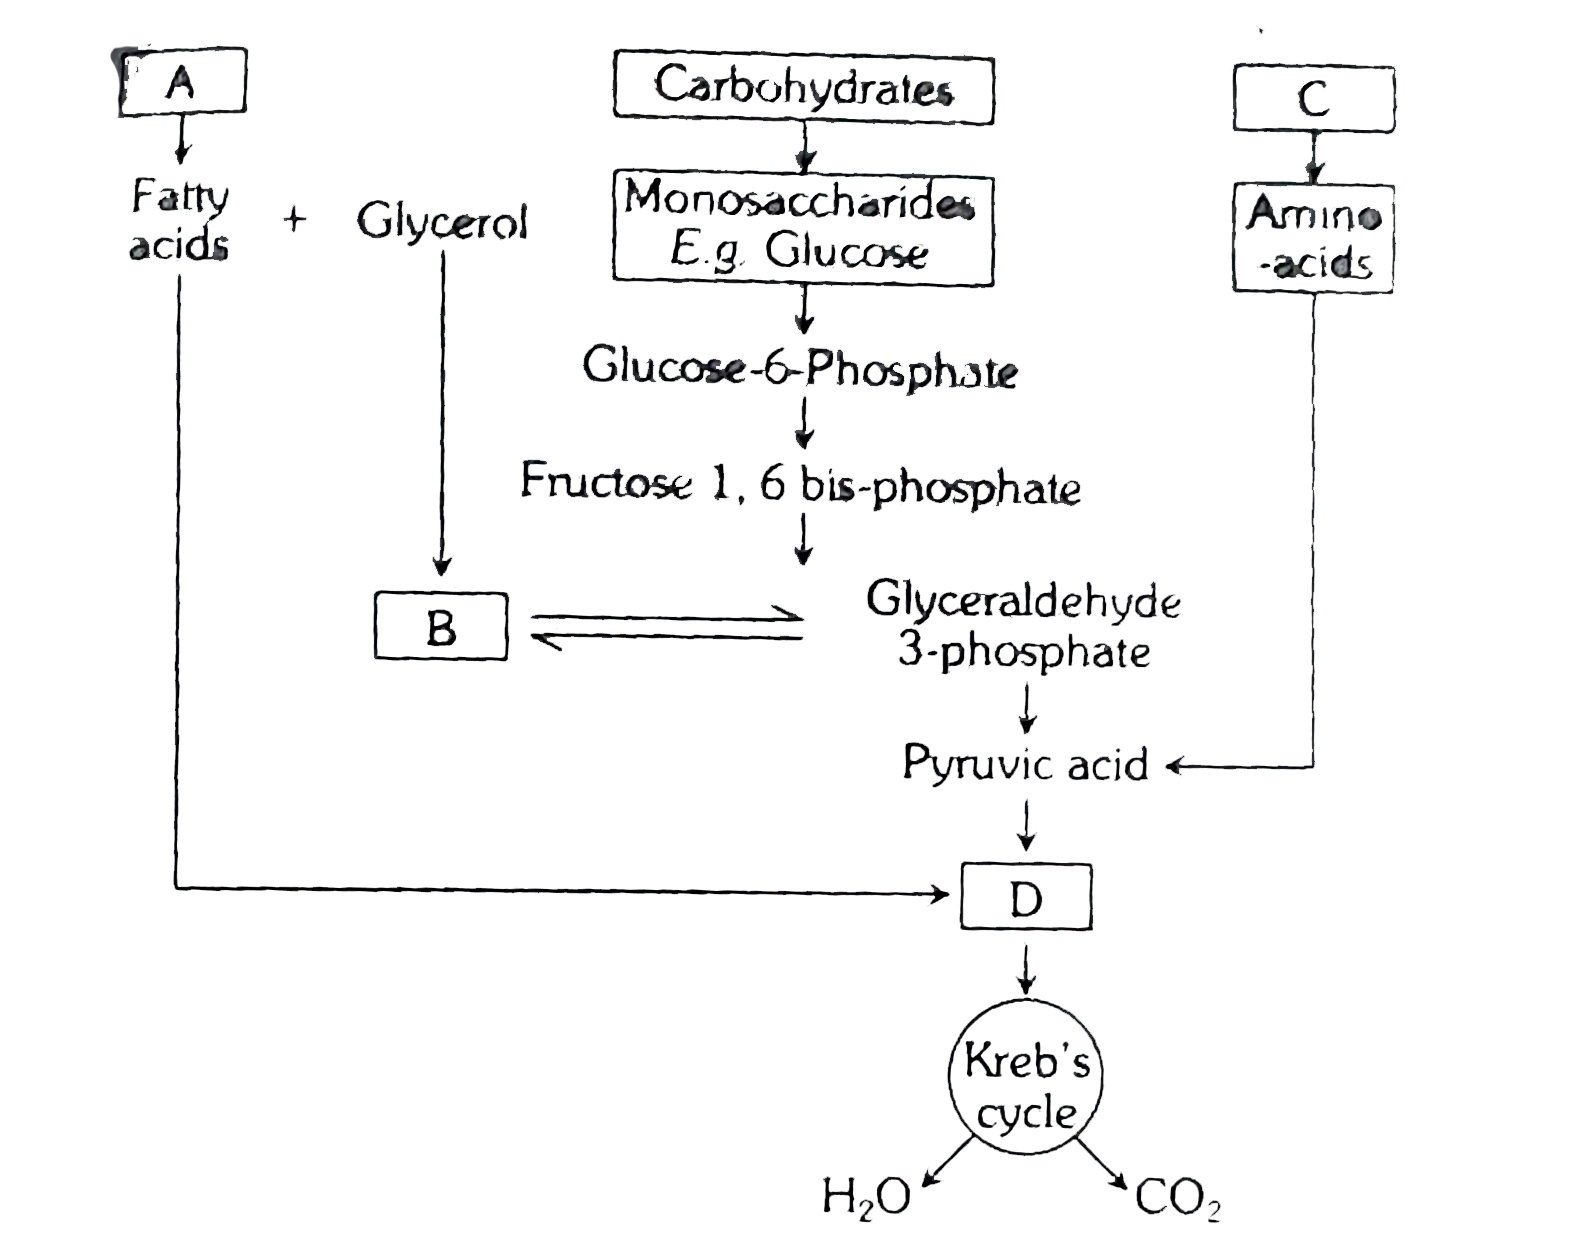
- The givn figure indicates the inteerrelationship among meabolic pathwa...
Text Solution
|
- Observe the following figure indicating the male reproductive system o...
Text Solution
|
- Seet the following figures and identify the type of simple tissue indi...
Text Solution
|
- The given figure indicates the stages of seed gremination Identify A,B...
Text Solution
|
- The givn figure indicates the inteerrelationship among meabolic pathwa...
Text Solution
|
- The given figure indicates the development of root nodule in soyabean ...
Text Solution
|
- See the following figures Figure A and B indicate glands while Fi...
Text Solution
|
- Identify the pair that indicates isobars among the following.
Text Solution
|
- Label (a), (b), (c) and (d) in the given figure showing the pathway of...
Text Solution
|