A
B
C
D
Text Solution
Verified by Experts
The correct Answer is:


Similar Questions
Explore conceptually related problems
Recommended Questions
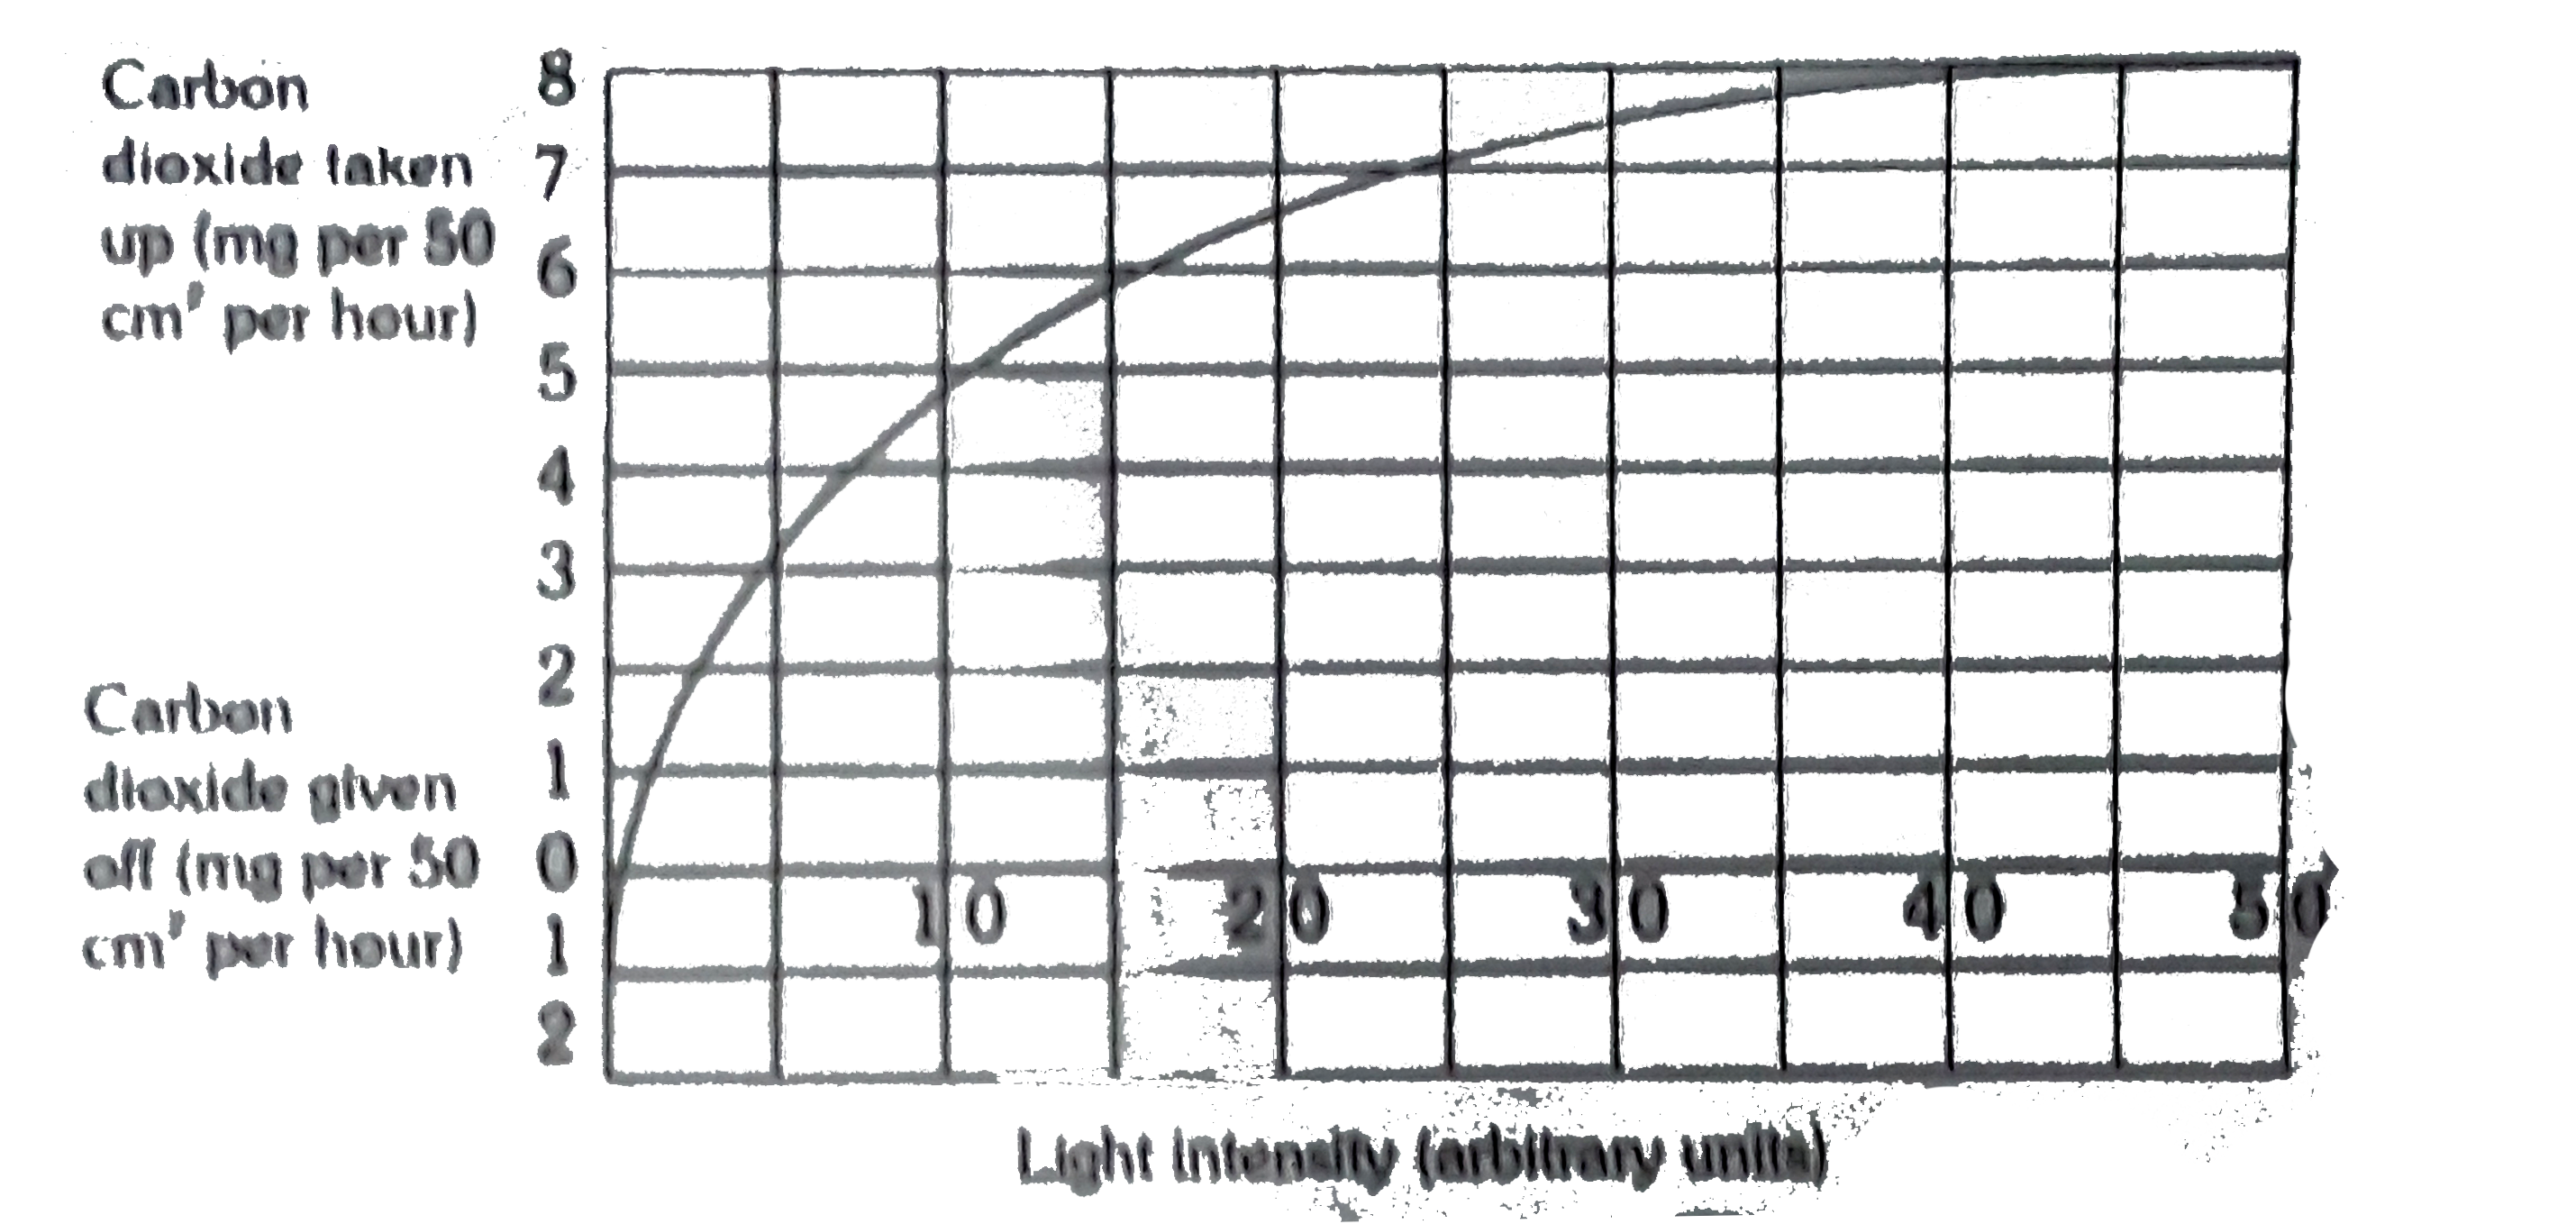
- The graph shows the relation between light intensity and the giving of...
Text Solution
|
- The graph shows the relation between light intensity and the giving of...
Text Solution
|
- पत्तियों द्वारा कार्बन डाइऑक्साइड या ऑक्सीजन लेने की क्रिया को
Text Solution
|
- Light dependent uptake of oxygen and release of carbon dioxide is .......
Text Solution
|
- Describe the effect of light and carbon dioxide on the rate of photosy...
Text Solution
|
- Plants take in carbon dioxide for photosynthesis but need ………… for the...
Text Solution
|
- The formation of carbohydrates by plants in the presence of water, lig...
Text Solution
|
- Graph by intensity of light and leaves of plants CO2 Shows the relatio...
Text Solution
|
- The graph shows the relation between light intensity and the giving of...
Text Solution
|