A
B
C
D
Text Solution
Verified by Experts
The correct Answer is:


Similar Questions
Explore conceptually related problems
Recommended Questions
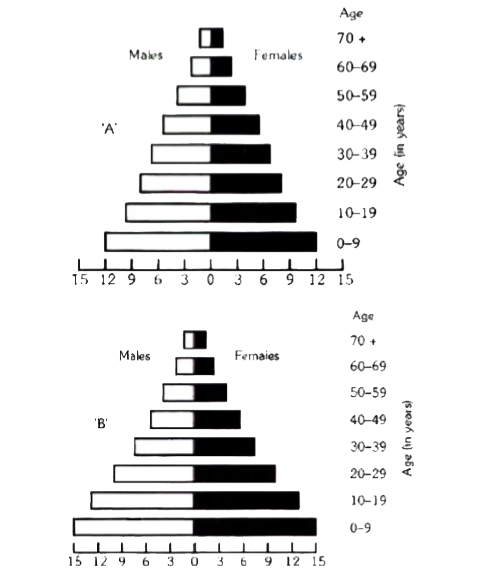
- A country with a high rate of population growth took measures to reduc...
Text Solution
|
- A country with a high rate of population growth took measures to reduc...
Text Solution
|
- A country with a high rate of population growth took measures to reduc...
Text Solution
|
- A country with a high rate of population growth took measures to reduc...
Text Solution
|
- একটি দেশের জনসংখ্যা 50 বছরে দ্বিগুণ হয়। যদি জনসংখ্যা বৃদ্ধির হার অধিব...
Text Solution
|
- WHICH COUNTRY HAS HIGH POPULATION GROWTH RATE
Text Solution
|
- दिये गये चित्र के सन्दर्भ में सही विकल्प चुनिये :
Text Solution
|
- A country with a high rate of population growth took measures to reduc...
Text Solution
|
- The births and deaths of four populations A, B, C and D in a year are ...
Text Solution
|