Text Solution
Verified by Experts
The correct Answer is:


Similar Questions
Explore conceptually related problems
Recommended Questions
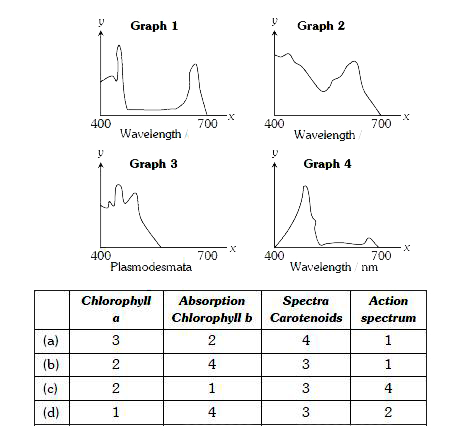
- Three of the graphs below show the absorption spectra of photosyntheti...
Text Solution
|
- Three of the graphs below show the absortion spectra of photosynthetic...
Text Solution
|
- The graph below represents the absorption spectrum of major pigment co...
Text Solution
|
- Assertion: Chlorophyll a is the chief pigment associated with photosyn...
Text Solution
|
- The graph showing rate of photosynthesis at different wavelength of li...
Text Solution
|
- What can we conclude from the statement that the action and absorption...
Text Solution
|
- दिया गया ग्राफ तीन प्रकाश संश्लेषीय वर्णकों, क्लोरोफिल a, क्लोरोफिल b ...
Text Solution
|
- The graph showing rate of Photosynthesis at different wavelengths of l...
Text Solution
|
- नीचे दर्शाए गए चित्र में तीन ग्राफ प्रकाश संश्लेषी पिगमेंट के अवशोषण स...
Text Solution
|