A
B
C
D
Text Solution
Verified by Experts
The correct Answer is:


Similar Questions
Explore conceptually related problems
Recommended Questions
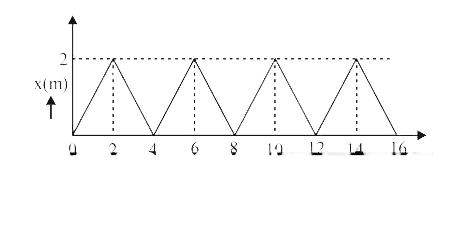
- The figure shows the position – time (x – t) graph of one – dimensiona...
Text Solution
|
- The figure shows the position-time (x-t) graph of one-dimensional moti...
Text Solution
|
- Figure shows the position-time (x-t) graph of one dimensional motion o...
Text Solution
|
- The figure shows the position - time (x - t) graph of one-dimensional ...
Text Solution
|
- चित्र में 0.04 kg सहती के किसी पिंड का स्थिति - समय ग्राफ दर्शाया जय...
Text Solution
|
- चित्र में 0.4 किग्रा द्रव्यमान के एक पिंड की एकविमीय गति का ( x -t) ग...
Text Solution
|
- The figure shows the position – time (x – t) graph of one – dimensiona...
Text Solution
|
- The position-time graph of a body of mass 0.04kg is shown in the figur...
Text Solution
|
- Figure shows the position-time graph of a body of mass 0.04 kg. Sugg...
Text Solution
|