A
B
C
D
Text Solution
Verified by Experts
The correct Answer is:


Similar Questions
Explore conceptually related problems
Recommended Questions
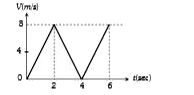
- v -t graph for a particle is as shown. The distance travelled in the f...
Text Solution
|
- The period of a particle in SHM is 8 s . At t = 0 it is in its equilib...
Text Solution
|
- A particle starts from rest and accelerated as shown in the graph. Det...
Text Solution
|
- The v - t graph for a particle is shown. The distance travelled in the...
Text Solution
|
- चित्र में x -अक्ष पर चलते हुए एक कण के वेग का समय के साथ ...
Text Solution
|
- The position - time graph for a particle moving along a straight line ...
Text Solution
|
- The speed verses time graph for a particle is shown in the figure. The...
Text Solution
|
- একটি বস্তুকণার বেগের সমীকরণ v=at। ওই বস্তুকণাটি প্রথম 4s এ যে দূরত্ব অ...
Text Solution
|
- किसी कण का वेग-समय ग्राफ दर्शाया गया है। प्रथम चार सेकण्ड में तय की गय...
Text Solution
|