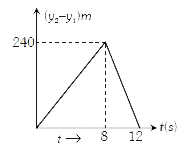
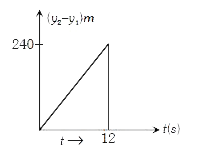
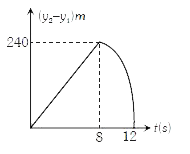
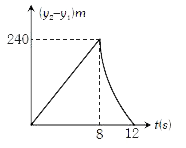
Home
Class 11
PHYSICS
Two stones are through up simultaneously...

Two stones are through up simultaneously from the edge of a cliff 240 m high with initial speed of 10 m/s and 40 m/s respectively. Which of the following graphs best represents the time variation of relative position of the second stone with respect to the first? Assume stones do not rebound after hitting the ground and neglect air resistance, take . ` g= 10 m//s^(2) ` (The figures are schematic and not drawn to scale)

A

B

C

D

Text Solution

Verified by Experts

The correct Answer is:
C

For the second stone time required to reach the ground is given by
` y = ut -1/2 "gt"^(2)`
` -240 = 40t -1/2 xx 10 xx t^(2)`
`(t-12) (t+8)=0`
` :. T=12s `
For the first stone :
` - 240 = 10t -1/2 xx 10 xx t^(2)`
` :. - 240 = 10t - 5t^(2)`
`5t^(2) - 10 t - 240 = 0`
`(t-8)(t+6)=0`
T=8s
During first 8 seconds both the stones are in air :
` :. y_(2) -y_(1) =(u_(2)-u_(1))t=30 t`
` :. ` graph of `(y_(2)-y_(1))` against t is a straight line
After 8 seconds
`y_(2)=u_(2)t-1/2"gt"^(2) - 240`
Stone two has acceleration with respect to stone one .
Promotional Banner

Similar Questions

Explore conceptually related problems

Two stones are thrown up simultaneously from the edge of a cliff 240 m high with initial speed of 10 m//s and 40 m//s respectively . Which of the following graph best represents the time variation of relative position of the speed stone with respect to the first ? ( Assume stones do not rebound after hitting the groumd and neglect air resistance , take g = 10 m//s^(2)) ( The figure are schematic and not drawn to scale )

Two stones are thrown up simultaneously from the edge of a cliff 200 m high with initial speeds of 15 ms?^(-1) and 30^(-1) . Verify that the graph shown in Fig. 2 ( NCT). 13 , correctly represents the time variation of the relativ e position of the second stone with respect to the first. Neglect the air resistance and assume that the stones do not rebound after hitting the ground. Taje g= 10 ms^(-2) .Give equations for the linear and curved parts of the plot. .

Two stones are thrown up simultaneously with initial speeds of u_(1) and u_(2)(u_(2)gt_(1) u_(1)) . They hit the ground after 6 s and 10 s respectively. Which graph in fig. correctly represents the time variation of Deltax=(x_(2)-x_(1)) the relative position of the second stone with respect to the first upto t=10 s? Assume that the stones do not rebound after hitting the ground.

Two stones are thrown up simultaneously from the edge of a cliff with initial speed v and 2 v . The relative position of the second stone with respect to first varies with time till both the stones strike the ground as.

One stone is projected horizontally from a 20 m high cliff with an initial speed of 10 ms^(-1) . A second stone is simultaneously dropped from that cliff. Which of the following is true?

Two stones are thrown vertically upwards simultaneously from the same point on the ground with initial speed u_(1) = 30 m//sec and u_(2) = 50 m//sec . Which of the curve represent correct variation (for the time interval in which both reach the ground) of (x_(2) - x_(1)) = the relative position of second stone with respect to first with time (t) (v_(2) - v_(1)) = the relative velocity of second stone with respect to first with time (t). Assuming that stones do not rebound after hitting.

A man standing on the edge of a cliff throws a stone straight up with initial speed (u) and then throws another stone straight down with same initial speed and from the same position. Find the relation of the speeds. The stones would have attained when they hit ground at the base of the cliff.