A
B
C
D
Text Solution
Verified by Experts
The correct Answer is:


Similar Questions
Explore conceptually related problems
Recommended Questions
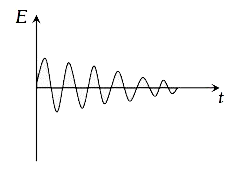
- Which of the diagram shown in figures respresents variation of total m...
Text Solution
|
- Which of the diagrams shown in figure, represents variation of total m...
Text Solution
|
- The diagram shown the energy levels for an electron in a certain atom....
Text Solution
|
- The potential energy U(x) of a particle moving along x- axis is shown ...
Text Solution
|
- The velocity-time diagram of a harmonic oscillator is shown in the adj...
Text Solution
|
- Which of the diagram shown in figures respresents variation of total m...
Text Solution
|
- The phase space diagram for harmonic motion is a circle centered at th...
Text Solution
|
- A satellite is orbiting earth at a distance r. Variations of its kinet...
Text Solution
|
- The variation of the potential energy of harmonic oscillator is as sho...
Text Solution
|