A
B
C
D
Text Solution
Verified by Experts
The correct Answer is:


Similar Questions
Explore conceptually related problems
Recommended Questions
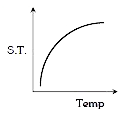
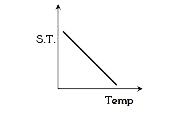
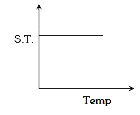
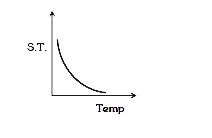
- Which graph represents the variation of surface tension with temperatu...
Text Solution
|
- Which graph represents the variation of surface tension with temperatu...
Text Solution
|
- The graph which represents the variation of mean kinetic energy of mol...
Text Solution
|
- निम्न में से किस ताप पर जल का पृष्ठ तनाव न्यूतम होगा ?
Text Solution
|
- Which one of the following represents correctly the variations of surf...
Text Solution
|
- Which one of the following graphs represents the variation of surface ...
Text Solution
|
- निम्न में से किस ताप पर जल के पृष्ठ तनाव का मान न्यूनतम होगा -
Text Solution
|
- which of the following graph represents the variation of resistivity (...
Text Solution
|
- कौन-सा ग्राफ ताप की न्यून परास में जल के पृष्ठ तनाव में ताप के स्थ पर...
Text Solution
|