A
B
C
D
Text Solution
Verified by Experts
The correct Answer is:


Similar Questions
Explore conceptually related problems
Recommended Questions
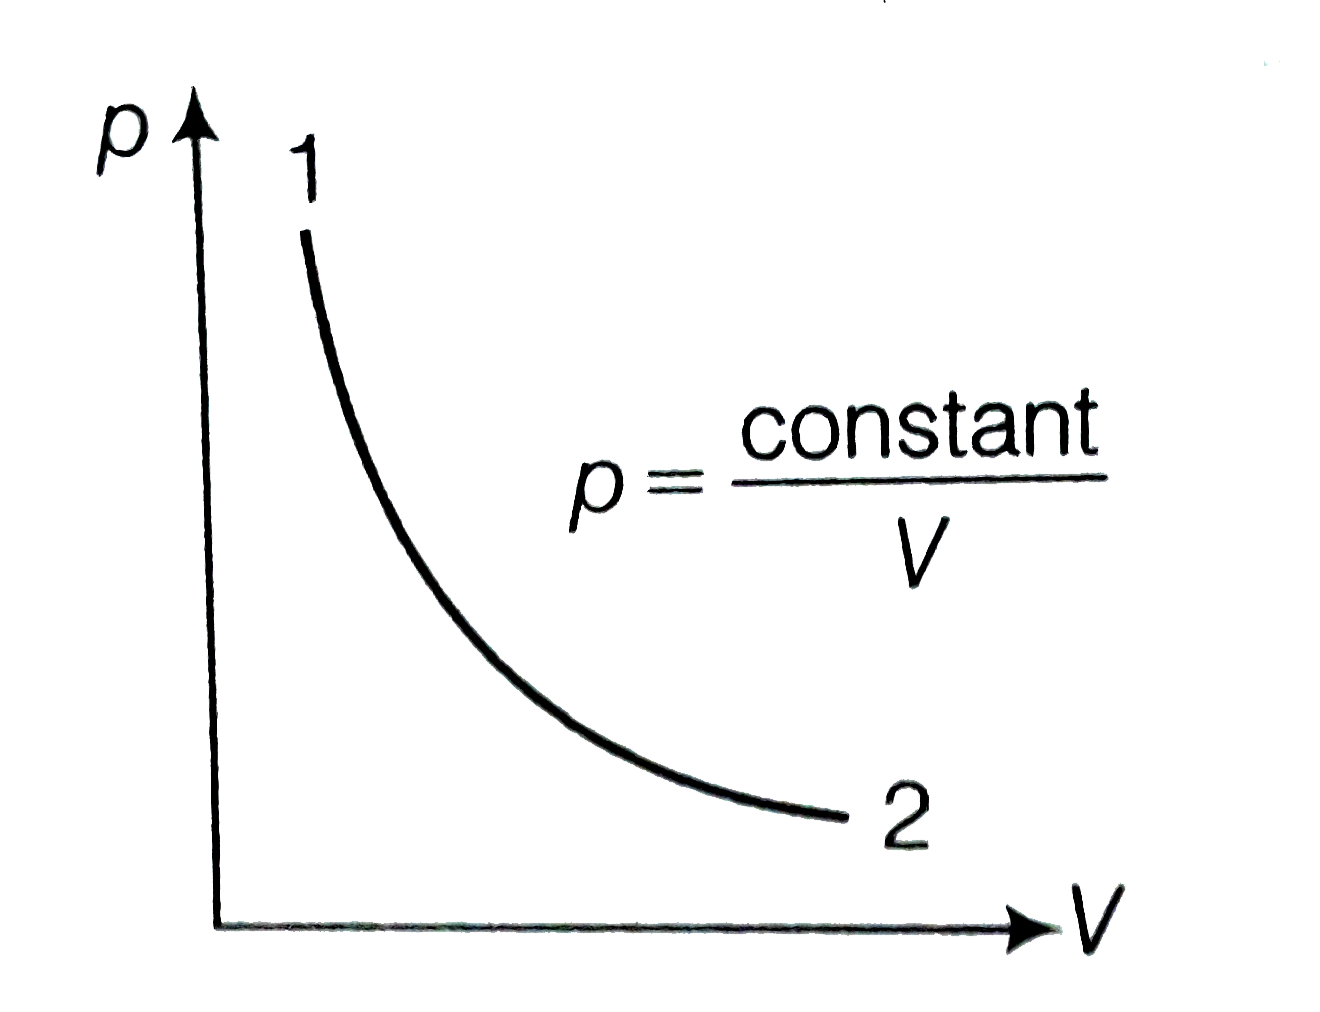
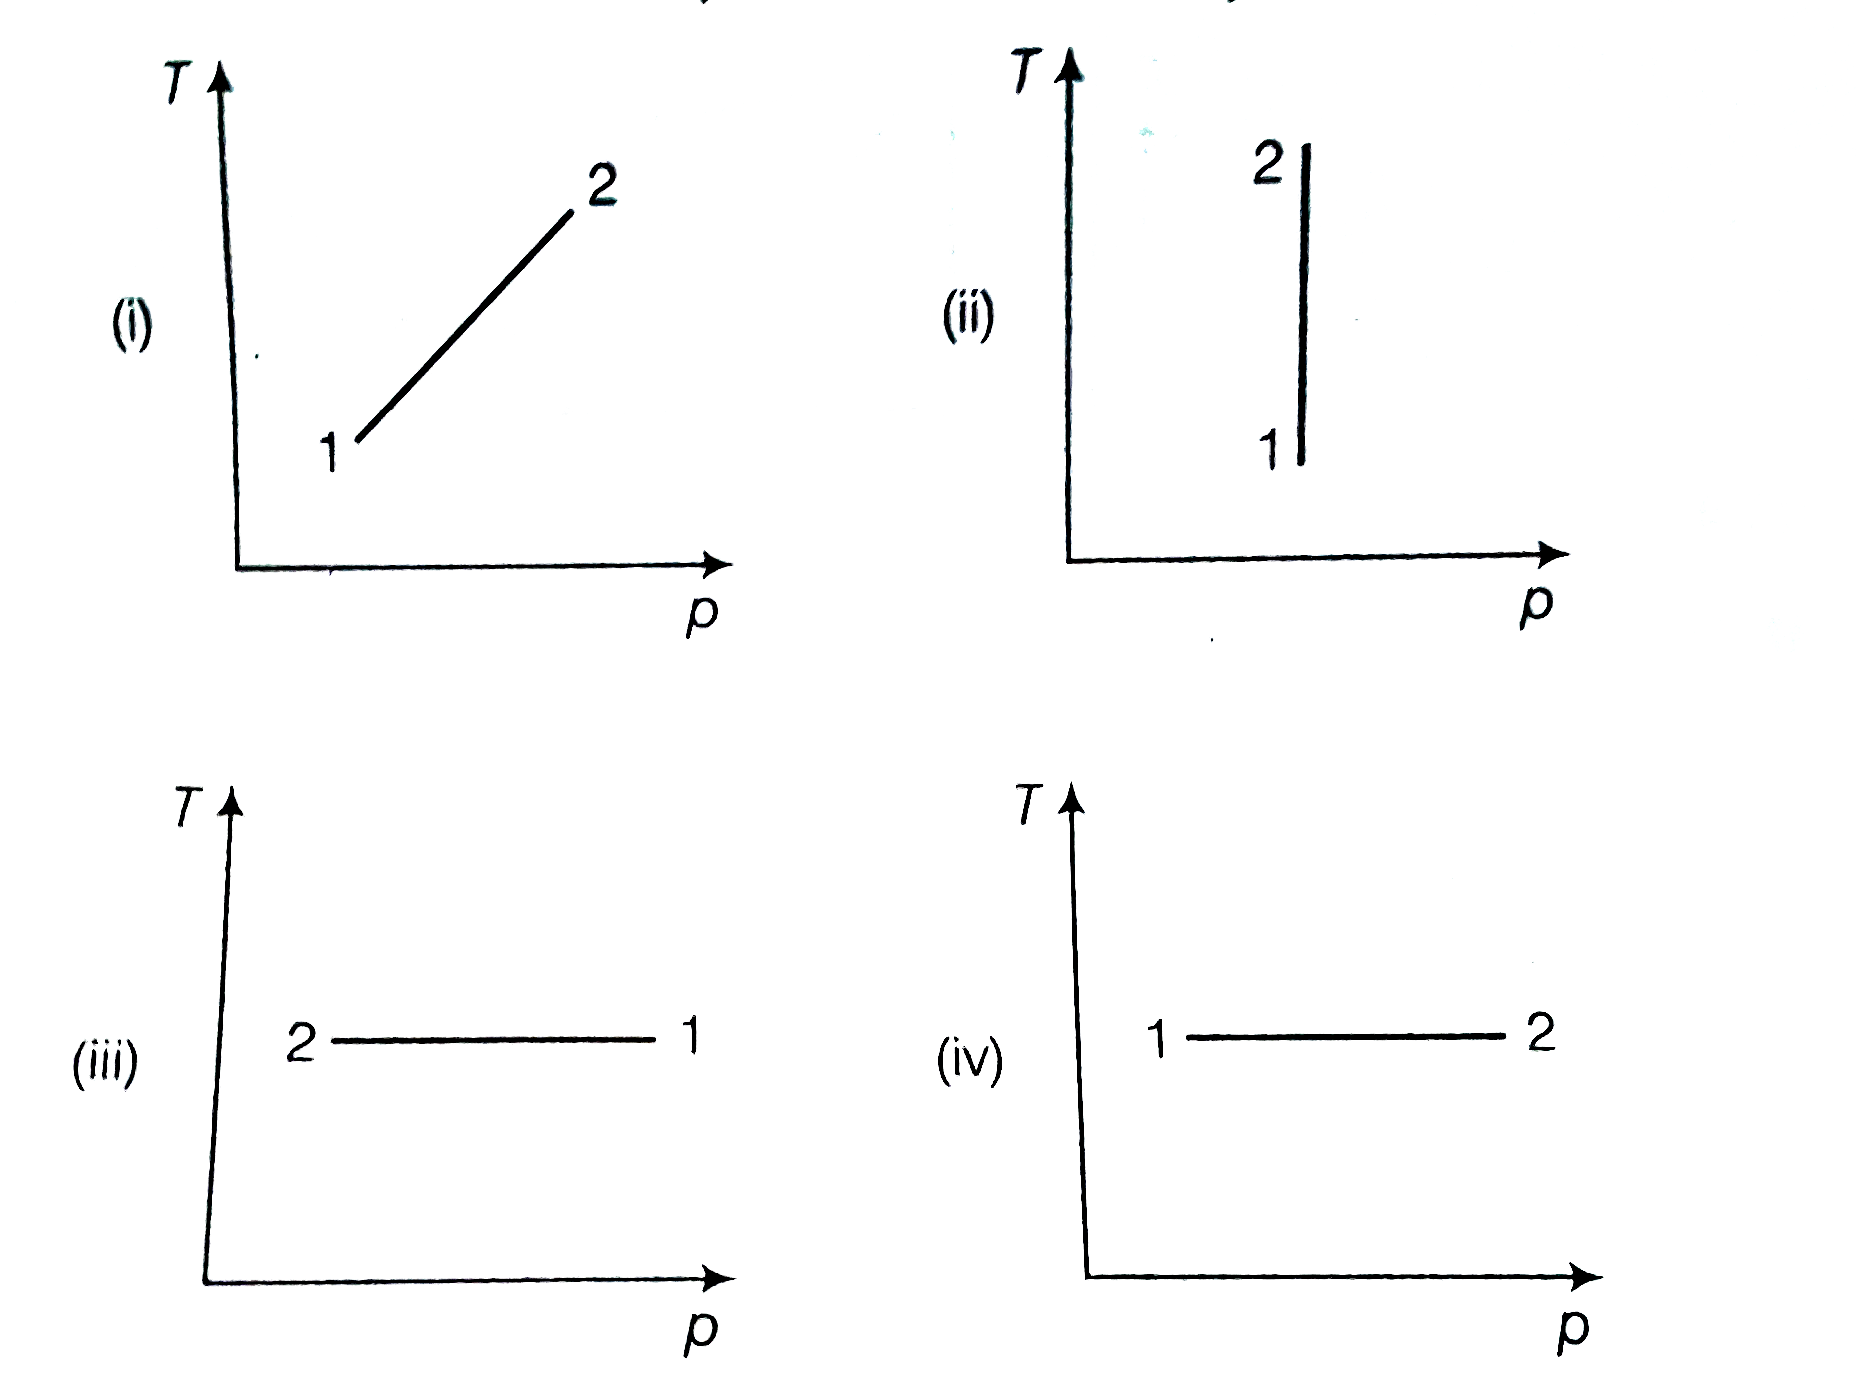
- Consider p-V diagram for an ideal gas shown in figure. Out of the...
Text Solution
|
- P - V diagram of an ideal gas is as shown in figure. Work done by the ...
Text Solution
|
- Consider P-V diagram for an ideal gas shown in figure. Out of followin...
Text Solution
|
- An ideal gas underoges cyclic process of ABCDA as shown in Given P-V d...
Text Solution
|
- A cyclic process 1rarr2rarr3rarr1 shown in P-T diagram is performed wi...
Text Solution
|
- Consider p - V diagram for an ideal gas shown in figure. Out of the fo...
Text Solution
|
- एक आदर्श गैस के लिए p - T आरेख चित्रानुसार है, AC रुद्धोष्म प्रक्रम है...
Text Solution
|
- Consider P to V diagram for an ideal gas shown in figure. Out of...
Text Solution
|
- P-V diagram of an ideal gas is as shown in figure. Work done by the ga...
Text Solution
|