A
B
C
D
Text Solution
Verified by Experts
The correct Answer is:


Similar Questions
Explore conceptually related problems
Recommended Questions
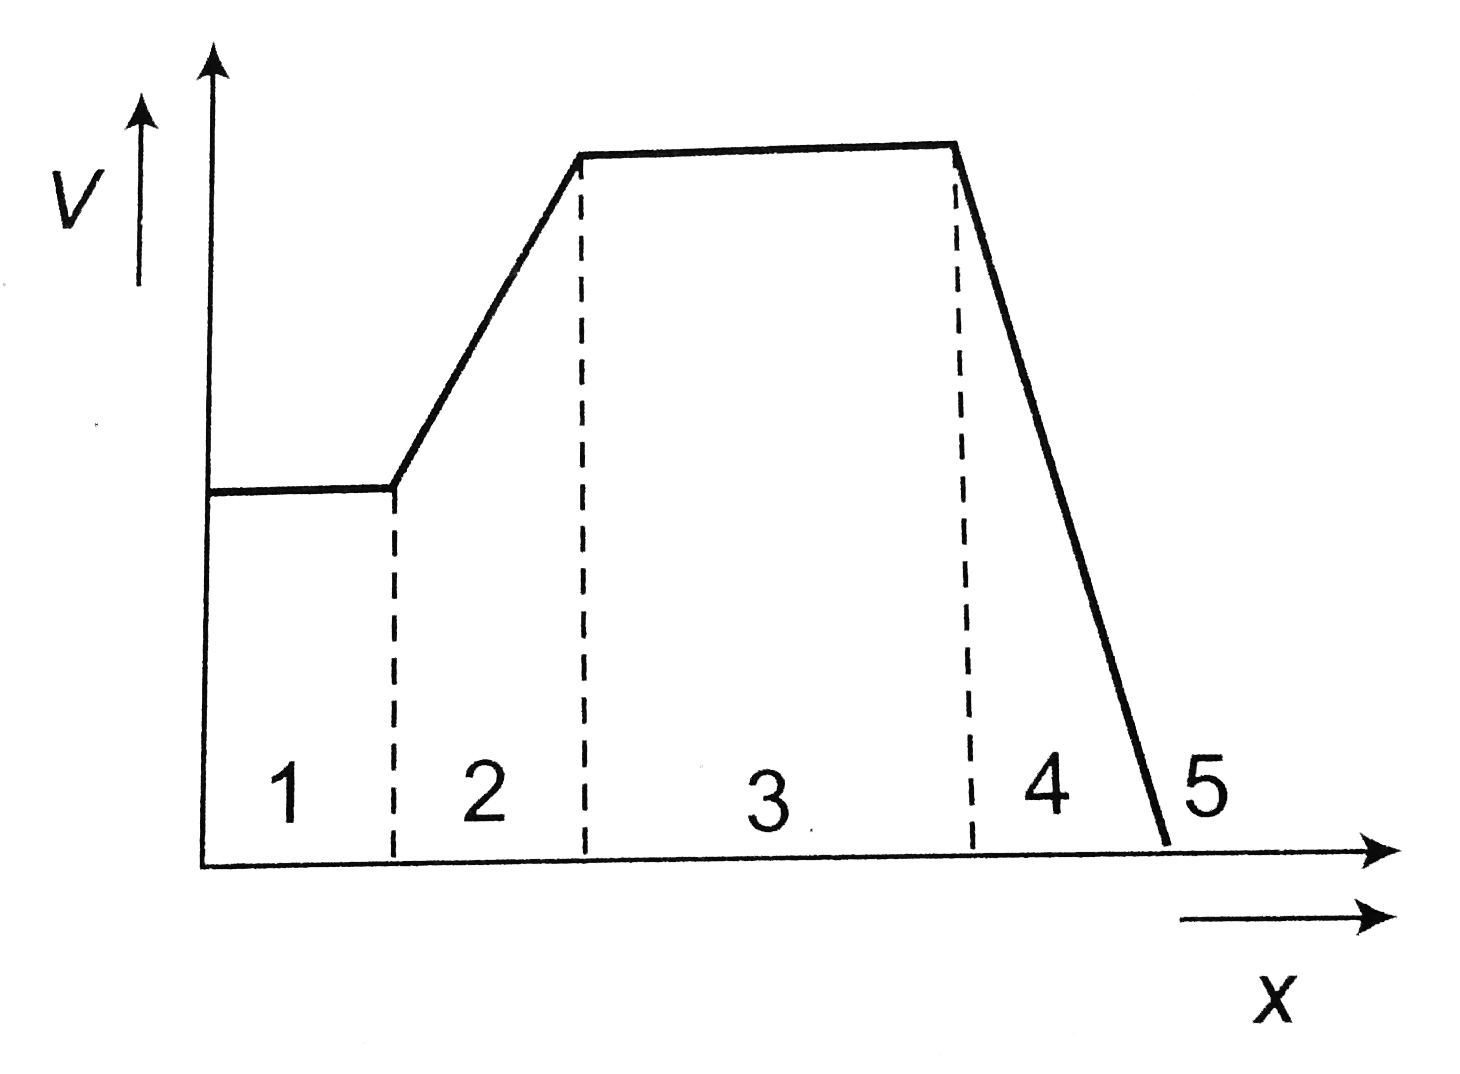
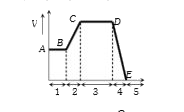
- The figure gives the electric potential V as a function of distance th...
Text Solution
|
- Which of the following is true for the figure showing electric lines o...
Text Solution
|
- A graph of the x-component of the electric field as a function of x in...
Text Solution
|
- The figure gives the electric potential V as a function of distance th...
Text Solution
|
- In the region where electric field E = 0 , the relation between electi...
Text Solution
|
- Which of the following is not true for a region with a uniform electri...
Text Solution
|
- In a certain region of space the electric potential V is known to be ...
Text Solution
|
- निम्न चित्र में विभव V का x-अक्ष पर पांच क्षेत्रों में दूरी के साथ परि...
Text Solution
|
- The figure gives the electric potential V as a function of distance th...
Text Solution
|