A
B
C
D
Text Solution
Verified by Experts
The correct Answer is:


Similar Questions
Explore conceptually related problems
Recommended Questions
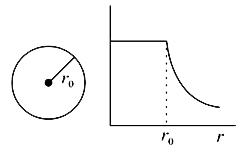
- The given graph shows variation (with distance r from centre) of:
Text Solution
|
- Which of the following graphs shows the variation of magnetic inductio...
Text Solution
|
- The given graph shows variation (with distance r form center) of :
Text Solution
|
- Draw a graph of show the variation of E with perpendicular distance r ...
Text Solution
|
- Which of the following graphs shows the variation of magnetic inductio...
Text Solution
|
- The given graph shows variation (with distance r from centre) of:
Text Solution
|
- The given graph shows variation (with distance r from centre) of:
Text Solution
|
- Draw a graph showing the variation of 'g' with distance from the centr...
Text Solution
|
- Draw a graph showing the variation of 'g' with distance from the centr...
Text Solution
|