Home
Class 12
PHYSICS
The V - i graph for a conductor at temp...

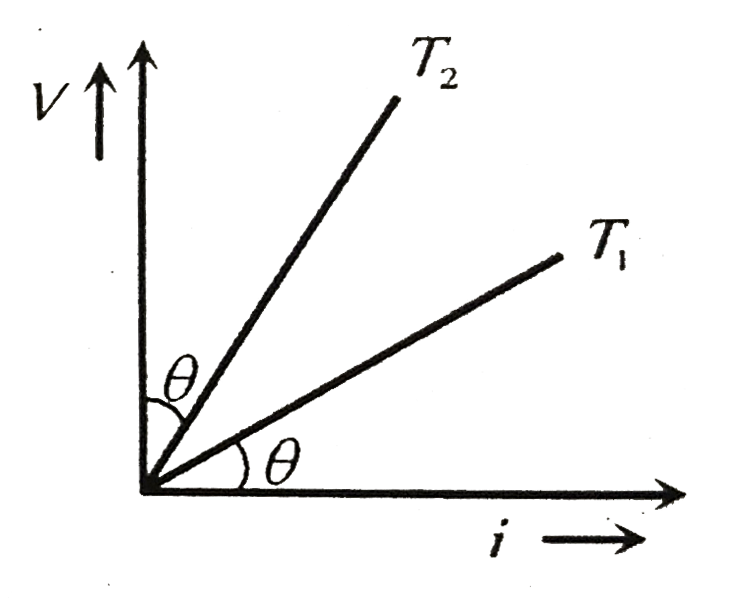
The V - i graph for a conductor at temperature `T_(1)` and `T_(2)` are as shown in the figure. `( T_(2) - T_(1))` is proportional to

A

`cos 2theta`

B

`sin theta`

C

`cot 2theta`

D

`tan theta`

Text Solution

Verified by Experts

The correct Answer is:
C

For conductors, resistance ∝ temperature
i.e., `R prop T`
`R_(1) = tan theta_(1)` and `R_(2) = tan (90 - theta) prop T_(2)`
`rArr tan theta_(1) = kT_(1)` and `cot theta = kT_(2)`
Now, `k(T_(2)-T_(1)) prop T_(1)` and `R_(2) = tan (90- theta) prop T_(2)`
Now
`k(T_(2)-T_(1)) = cot theta - tan theta =((cos theta)/(sin theta) - (sin theta)/(cos theta))`
`therefore (T_(2)-T_(1)) prop cot 2theta`
Promotional Banner

Similar Questions

Explore conceptually related problems

The V-l graph for a conductor at temperatures T_(1) " and " T_(2) are as shown in the figure. The term T_(2) -T_(1) is proportional to

The V-i graph for a conductor at temeratures T_1 and T_2 are as shown in the figure. (T_2 - T_1) is alphaortional to. .

The V - I graphs for a conductor at temperature T_1 and T_2 are shown in the figure (T_2-T_1) is proportional to

The voltage V and current I v graphs for a conductor at two different temperatures T_(1) and T_(2) are shown in the figure. The relation between T_(1) and T_(2) is

Assertion : Current versus potential difference (i-V) graph for a conductor at two different temperatures T_(1) and T_(2) is shown in figure. Hence T_(1)gt T_(2) . Reason : Resistance of a conductor increases with rise in temperature.

The current-coltage graphs for a given metallic wire at two differenct tempeature T_(1)" and "T_(2) are shown in the figure. Which one is higher, T_(1)" or "T_(2)

Determine the tensions T_(1) and T_(2) in the string as shown in figure.

The current - voltage graphs for a given metallic wire at two different temperatures T_1 and T_2 are shown in the figure. The temperature T_2 is greater than T_1 .