A
B
C
D
Text Solution
Verified by Experts
The correct Answer is:


Similar Questions
Explore conceptually related problems
Recommended Questions
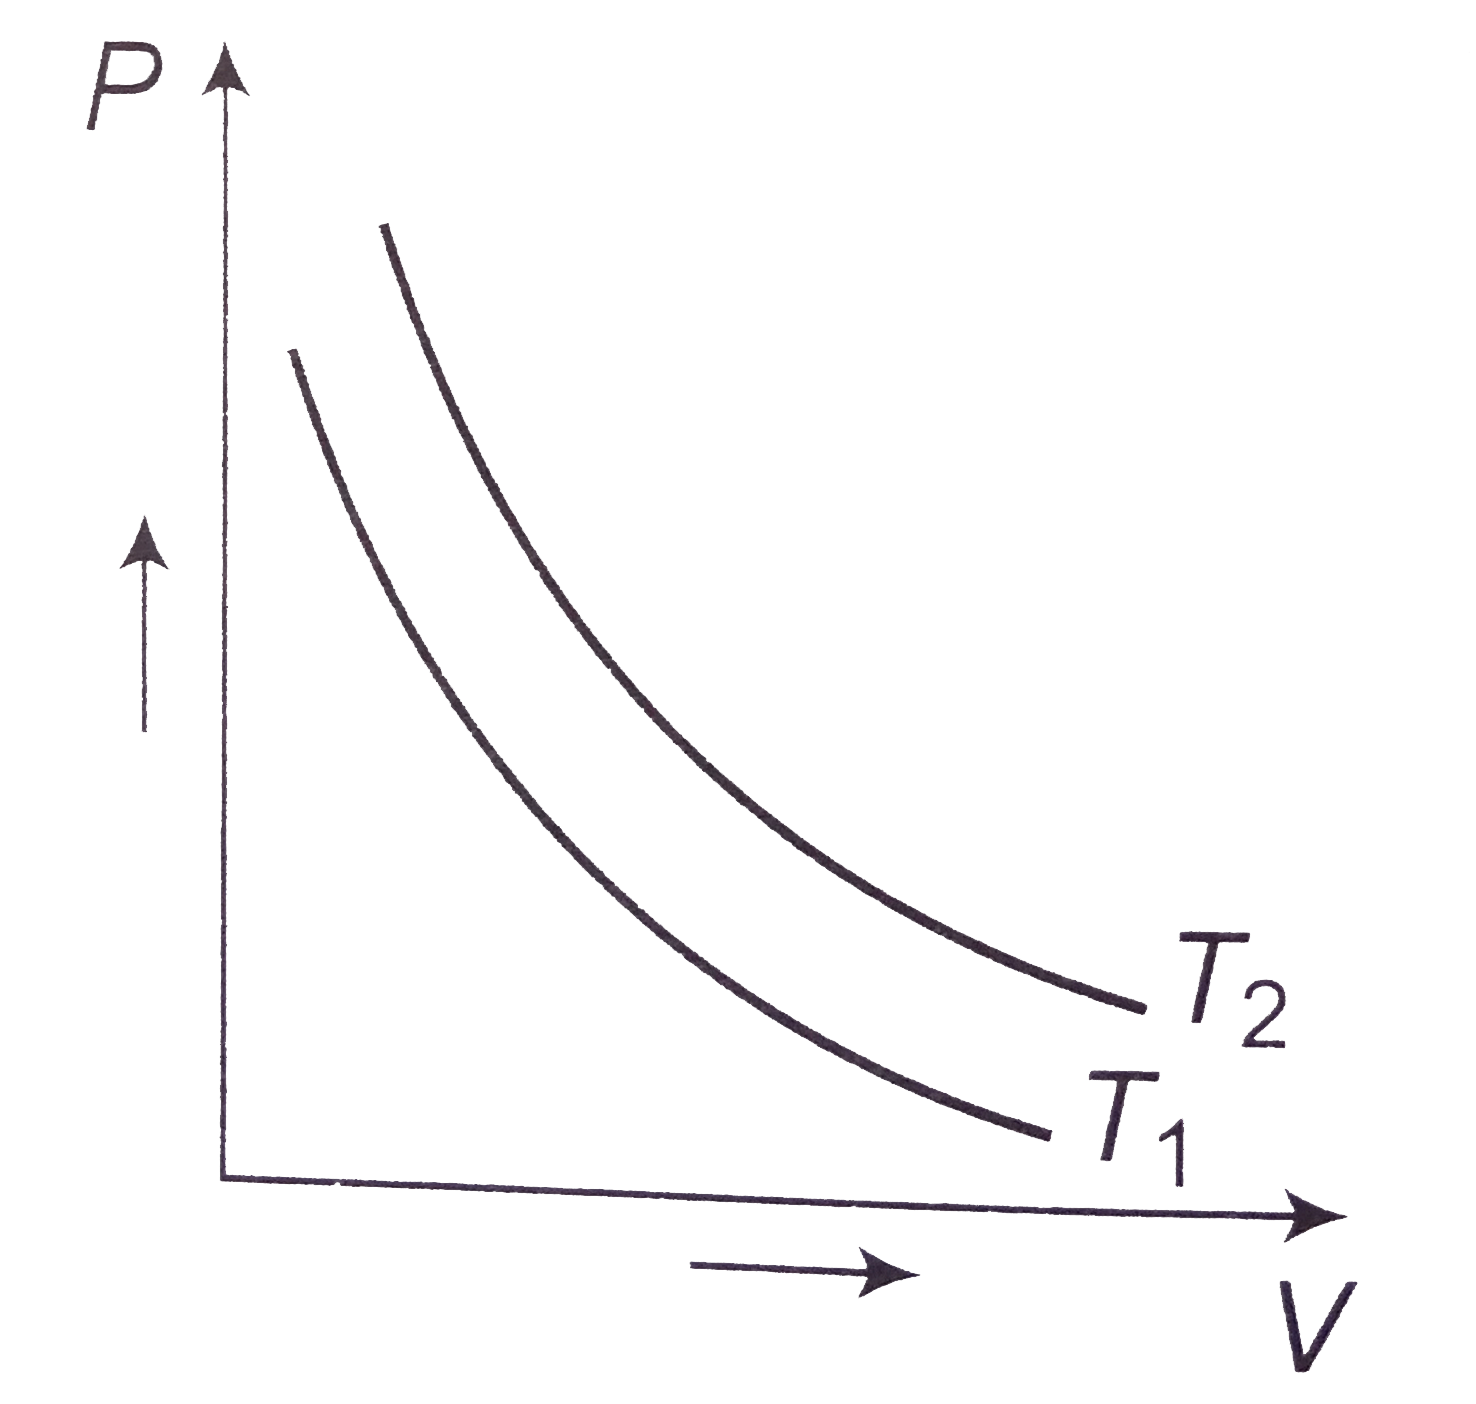
- The adjoining figure shows graphs of pressure and volume of a gas at t...
Text Solution
|
- The current - voltage graphs for a given metallic wire at two differen...
Text Solution
|
- The adjoining figure shows graphs of pressure and volume of a gas at t...
Text Solution
|
- The adjoining fgure shows graph of pressure and volume of a gas at two...
Text Solution
|
- The V - I graphs for a conductor at temperature T1 and T2 are shown in...
Text Solution
|
- The product (PV) is plotted against P at two temperature T1 and T2 and...
Text Solution
|
- Figure shows graphs of pressure versus density for an ideal gas at two...
Text Solution
|
- Diagram shows a graph between pressure and density for an ideal gas at...
Text Solution
|
- Diagram shows a graph between pressure and density for an ideal gas at...
Text Solution
|