A
B
C
D
Text Solution
Verified by Experts
The correct Answer is:


Similar Questions
Explore conceptually related problems
Recommended Questions
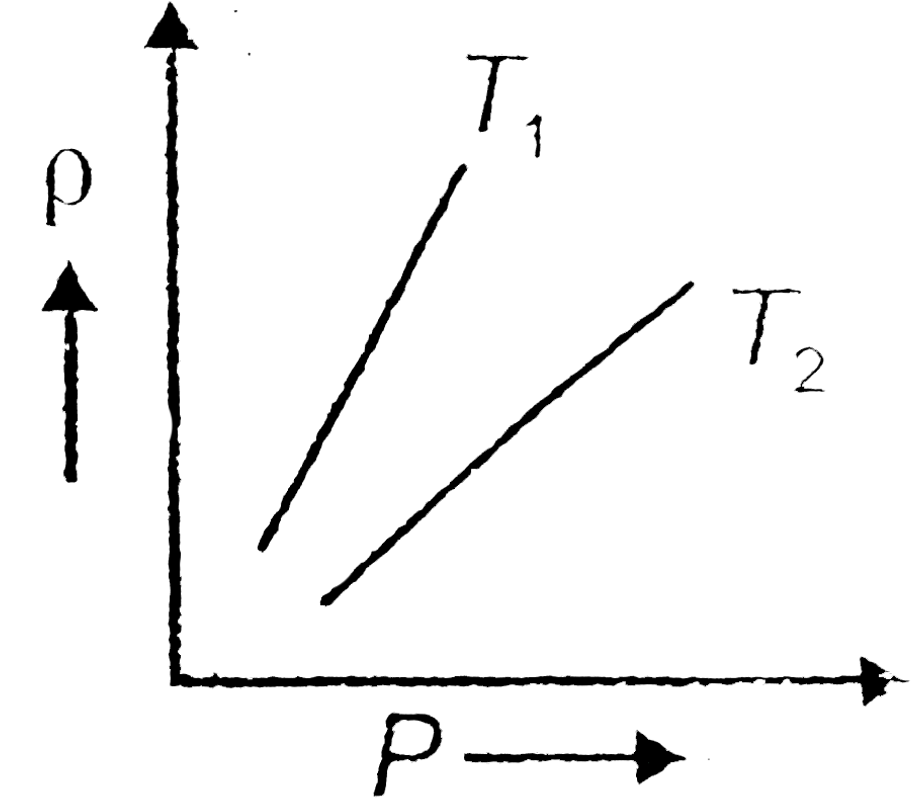
- The density (rho) versus pressure (P) graphs of a given mass of an ide...
Text Solution
|
- Shows graphs of pressure vs density for an ideal gas at two temperatur...
Text Solution
|
- Figure shows graphs of pressure vs density for an ideal gas at two tem...
Text Solution
|
- Figure shows graphs of pressure versus density for an ideal gas at two...
Text Solution
|
- Figure shows graphs of pressure vs density for an ideal gas at two tem...
Text Solution
|
- Figure shows graphs of pressure vs density for an ideal gas at two tem...
Text Solution
|
- The density (rho) versus pressure (P) graphs of a given mass of an ide...
Text Solution
|
- Isothermal curves for a given mass of gas are shown at two different t...
Text Solution
|
- Freundlich adsorption isotherms for the physical adsorption of a gas a...
Text Solution
|