A
B
C
D
Text Solution
Verified by Experts
The correct Answer is:


Similar Questions
Explore conceptually related problems
Recommended Questions
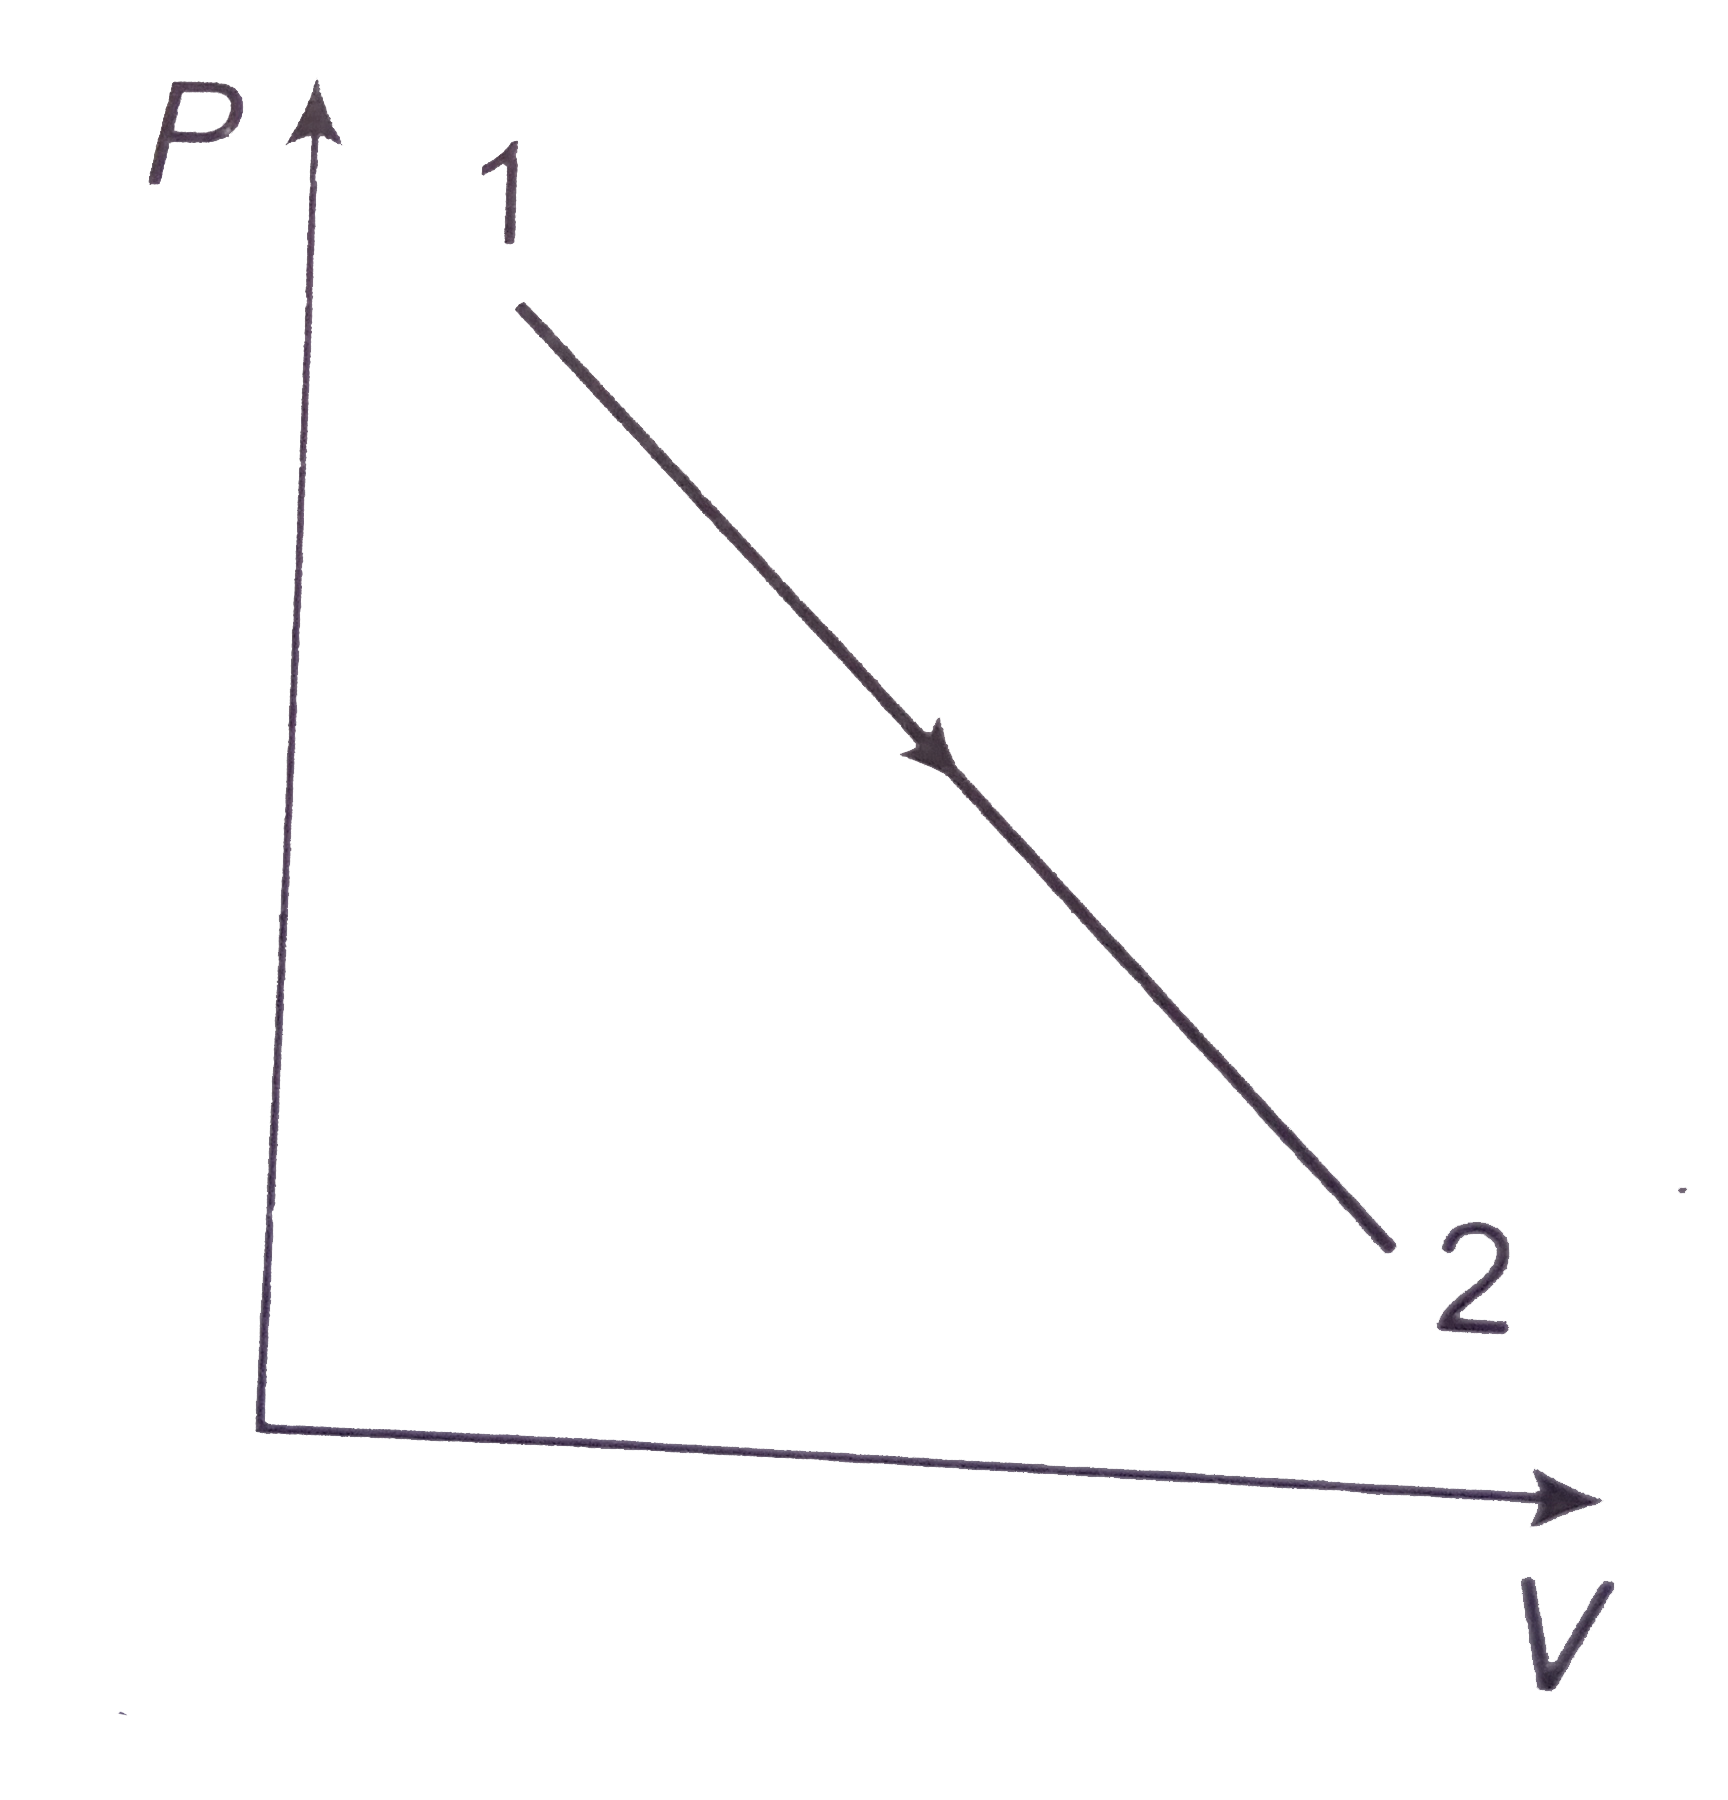
- P-V graph was obtained from state 1 to state 2 when a given mass of a ...
Text Solution
|
- A pressure P, absolute temperature T, graph was obtained whe a given m...
Text Solution
|
- P-V graph was obtained from state 1 to state 2 when a given mass of a ...
Text Solution
|
- The volume (V) of a monatomic gas varies with its temperature (T) as s...
Text Solution
|
- A volume V absolute temperature T diagram was obtained when a given ma...
Text Solution
|
- एक गैस की अवस्था में A से D तक परिवर्तन ग्राफ में प्रदर्शित है। इस प्र...
Text Solution
|
- What is the nature of graph of PV versus P for a given mass of a gas a...
Text Solution
|
- One mole of ideal gas goes through processP = (2V^2)/(1+V^2). Then ch...
Text Solution
|
- One mole of ideal gas goes through processP = (2V^2)/(1+V^2). Then ch...
Text Solution
|