A
B
C
D
Text Solution
Verified by Experts
The correct Answer is:


Similar Questions
Explore conceptually related problems
Recommended Questions
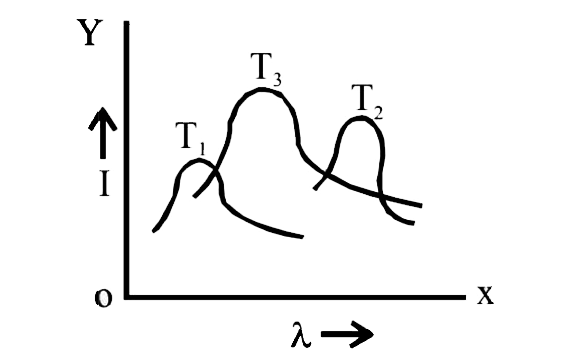
- The plots of intensity versus wavelength for three black bodies at tem...
Text Solution
|
- The plots of intensity versus wavelength for three black bodies at tem...
Text Solution
|
- The plots of intensity versus wavelength for three black bodies at tem...
Text Solution
|
- The plots of intensity of radiation versus wavelength of 3 black bodie...
Text Solution
|
- Show below are the black body radiation curves at temperature T1 and T...
Text Solution
|
- If for a black body the graph of change is emissive power at different...
Text Solution
|
- The plots of intensity versus wavelength for three black bodies at tem...
Text Solution
|
- For three black bodies which respectively T1,T2 and T3 The graphs draw...
Text Solution
|
- एक कृष्णिका दो तापों T1 तथा T2 पर ऊर्जा उत्सर्जित करती है तथा T1 lt T...
Text Solution
|