A
B
C
D
Text Solution
Verified by Experts
The correct Answer is:


Similar Questions
Explore conceptually related problems
Recommended Questions
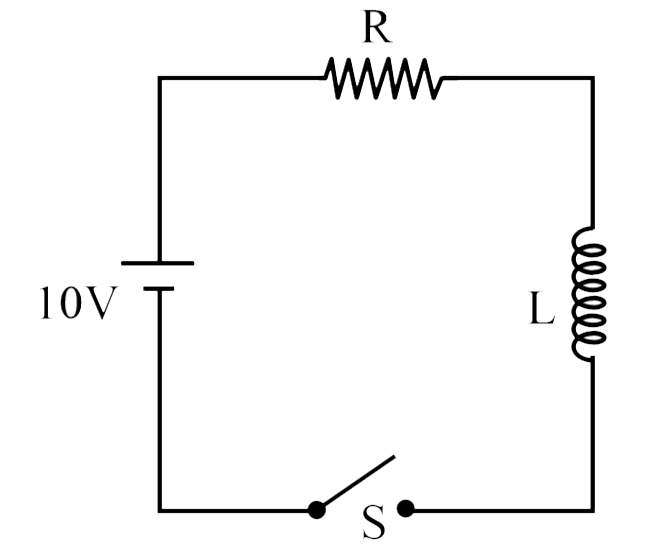
- In the circuit shown, the switch is closed at time t = 0. Which of t...
Text Solution
|
- In the circuit shown, switch S is closed at time t = 0 . Find the curr...
Text Solution
|
- A 1 -k Omega resistor is connected in series with a 10-mH inductor, a ...
Text Solution
|
- In the circuit as shown in figure the switch is closed at t = 0 . At t...
Text Solution
|
- In the circuit as shown in figure the switch is closed at t = 0 . A lo...
Text Solution
|
- Consider a circuit consists of resistors, inductor, battery and a swit...
Text Solution
|
- In the circuit diagram shown, intially there is no energy in the induc...
Text Solution
|
- In the circuit shown, the switch is closed at time t = 0. Which of the...
Text Solution
|
- In the circuit shown in figure-5.115, find the current in inductor as ...
Text Solution
|