A
B
C
D
Text Solution
Verified by Experts
The correct Answer is:


Similar Questions
Explore conceptually related problems
Recommended Questions
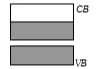
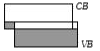
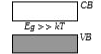
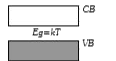
- Which of the energy band diagrams shown in the figure corresponds to t...
Text Solution
|
- Which of the following energy band diagrams shows the N -type semicond...
Text Solution
|
- Which of the energy band diagrams shown in the figure corresponds to t...
Text Solution
|
- The energy band diagrams for three semiconductor samples of silicon ar...
Text Solution
|
- Expalin the formation of energy band in solids. Draw energy band diagr...
Text Solution
|
- Draw the energy band diagram of an intrinsic semiconductor.
Text Solution
|
- p- प्रकार के अर्धचालक का ऊर्जा बैंड आरेख खीचिए | ताप बढ़ाने पर नेज अर्ध...
Text Solution
|
- Show the acceptor energy level in energy band diagram of p-type semico...
Text Solution
|
- निम्न में से कौन-सा ऊर्जा बैण्ड चित्र, अर्धचालक को प्रकट करता है?
Text Solution
|