A

B

C

D

Text Solution
Verified by Experts
The correct Answer is:


Similar Questions
Explore conceptually related problems
Recommended Questions
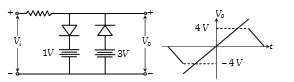
- The figure below shows a circuit and its input voltage V(i) as functi...
Text Solution
|
- In the circuit shown in figure the maximum output voltage V(0) is
Text Solution
|
- In a voltage regulating of zener diode, the graph of output voltage v(...
Text Solution
|
- In the circuit shown the switch is closed at time t = 0. Plot the foll...
Text Solution
|
- If the input voltage V(i) to the circuit below is given by V(i)(t) = A...
Text Solution
|
- In the figure, D is an ideal diode and an alternating voltage of peak ...
Text Solution
|
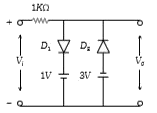
- What is the value of output voltage V(0) in the circuit shown in the f...
Text Solution
|
- Take the breakdown voltage of the zener diode used in the given circui...
Text Solution
|
- For the given input voltage wavelength V("in")(t) , the output voltage...
Text Solution
|