A
B
C
D
Text Solution
Verified by Experts
The correct Answer is:


Similar Questions
Explore conceptually related problems
Recommended Questions
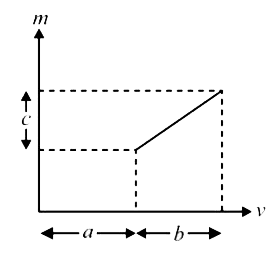
- The graph shows how the magnification m produced by a thin lens varies...
Text Solution
|
- Figure, shows variation of magnification m (produced by a thin convex ...
Text Solution
|
- The graph shows how the magnification m produced by a convex thin len...
Text Solution
|
- The graph in Fig. shows how the inverse of magnification 1//m produced...
Text Solution
|
- The graps shows the variation of magnification m produced by as convex...
Text Solution
|
- Variation of magnification "("m")" produced by a thin convex lens vers...
Text Solution
|
- The distance between an object and a divergent lens is m times the foc...
Text Solution
|
- The graph shows how the magnification m produced by a thin lens varies...
Text Solution
|
- दिए गए ग्राफ में एक पतले लेंस के आवर्धन को प्रतिबिम्ब की दूरी, v के सा...
Text Solution
|