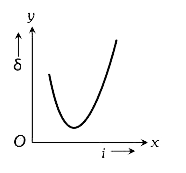
A
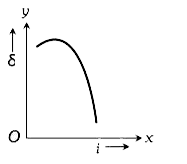
B
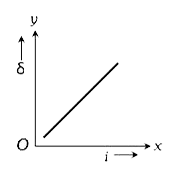
C
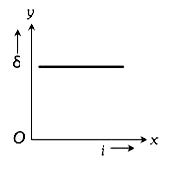
D
Text Solution
Verified by Experts
The correct Answer is:


Similar Questions
Explore conceptually related problems
Recommended Questions
- The graph between angle of deviation (delta) and angle of incidence (i...
Text Solution
|
- The graph between angle of deviation (delta) and angle of incidence (i...
Text Solution
|
- The relation between angle of incidence i, angle of prism A and angle ...
Text Solution
|
- The graph between angle of deviation (delta) and angle of incidence (i...
Text Solution
|
- Figure shown the graph of angle of deviation delta verses angle of inc...
Text Solution
|
- एक त्रिभुजाकार प्रिज्म के लिये विचलन कोण (delta) तथा आपतन कोण (i) में ...
Text Solution
|
- विचलन कोण का आपतन कोण के संगत ग्राफ किसी समबाहु त्रिभुज प्रिज्म के लि...
Text Solution
|
- The graph between angle of deviation (delta) and angle of incidence (i...
Text Solution
|
- एक त्रिभुजाकार प्रिज्म के लिए विचलन कोण (delta) और आपतन कोण (i) के बी...
Text Solution
|