A
B
C
D
Text Solution
Verified by Experts
The correct Answer is:


Similar Questions
Explore conceptually related problems
Recommended Questions
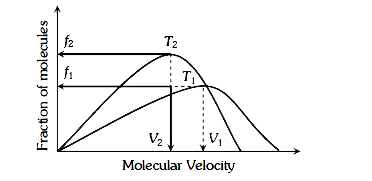
- Plot of Maxwell’s distribution of velocities is given below
Text Solution
|
- Plot of Maxwell's distribution of velocities is given below: which of ...
Text Solution
|
- नीचे दिये गये बंटन का माध्यक ( median ) ज्ञात कीजिए -
Text Solution
|
- In Maxwell’s velocity distribution curve area under the graph
Text Solution
|
- Plot of Maxwell's distribution of velocities is given below : Which of...
Text Solution
|
- Plat of Maxwell.s distribution of velocities is gives below : W...
Text Solution
|
- Plot of Maxwell's distribution of velocities is given below: Which of ...
Text Solution
|
- विस्थापन तथा समय के बीच निम्न ग्राफ प्राप्त होता है इसके संगत ...
Text Solution
|
- Plot of Maxwell's distribution of velocities is given below : Whi...
Text Solution
|