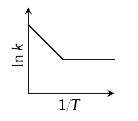
A
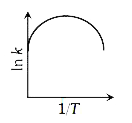
B
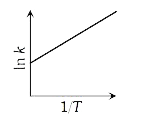
C
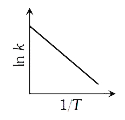
D
Text Solution
Verified by Experts
The correct Answer is:


Similar Questions
Explore conceptually related problems
Recommended Questions
- Among the following graphs showing variation of rate (k) with temperat...
Text Solution
|
- Plots showing the variation of the rate constant (k) with temperature ...
Text Solution
|
- The given graph shows the variation of resistance of mercury in the te...
Text Solution
|
- Which of the following graph is incorrect for variation of rate consta...
Text Solution
|
- Accroding to Arrhenius equation, the rate constnat (k) is related to t...
Text Solution
|
- Plots showing the variation of the rate constant (k) with temperature ...
Text Solution
|
- वेग स्थिरांक (rate constant) (K) तथा ताप (T) में खींचे गए ग्राफ नीचे...
Text Solution
|
- Plots showing the variation of the rate constant (k) with temperature ...
Text Solution
|
- Plots showing the variation of the rate constant (k) with temperature ...
Text Solution
|